DEEP RESEARCH · HANKOOK CAPITAL
Hankook Capital: Testing the Quality Behind Record 2025 Earnings and the KRW 10 Trillion Asset Scenario
A research report on KRW 100.5 billion net income, KRW 5.15 trillion assets, OCF, NPL risk and Military Mutual Aid Association support.
0. Bottom line first
My key read is that the record 2025 earnings were not a simple accounting event. They came from asset growth, investment-finance fees, direct corporate-finance channels and parent-company credit support. For 2026, however, asset quality matters more than headline growth.
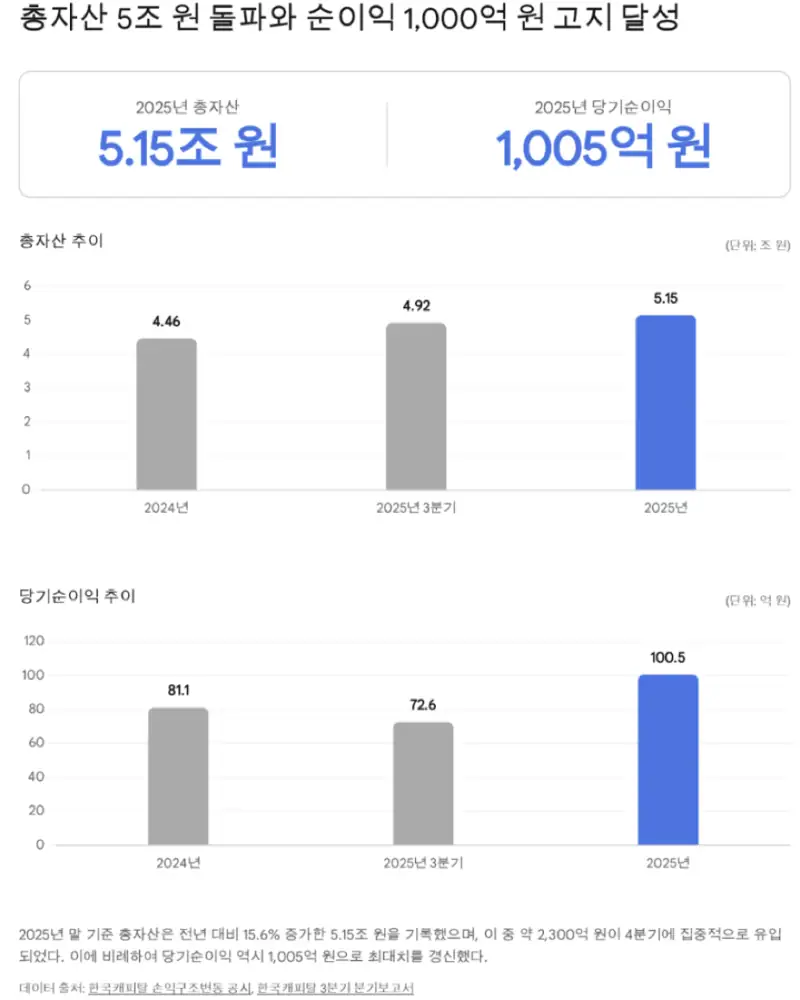
Official fact: Preliminary 2025 operating revenue was KRW 547.9 billion, up 17.14% YoY. Operating profit was KRW 127.9 billion, up 32.06%, net income was KRW 100.5 billion, up 23.89%, and total assets reached KRW 5.15 trillion. In 4Q alone, the source estimates roughly KRW 233.3 billion of asset growth and KRW 27.9 billion of net income.
Interpretation: As the source’s opening note flags, the Military Mutual Aid Association angle needs continued diligence. Its 80.41% ownership, KRW 150 billion of perpetual-bond support and KRW 700 billion guarantee capacity are a powerful moat, but how future growth capital is funded matters for minority shareholders.
1. Reading Q4 2025 earnings
The March 5, 2026 preliminary filing shows asset growth and earnings growth at the same time despite a difficult financial-sector backdrop. The source decomposes the filing’s phrase ‘expanded operating base’ into assets, portfolio mix and channel change.
| Metric | 2024 | 9M 2025 | 2025 preliminary | YoY/read-through |
|---|---|---|---|---|
| Total assets | KRW 4.4602tn | KRW 4.9225tn | KRW 5.1558tn | +15.6%; KRW 233.3bn added in 4Q |
| Operating revenue | KRW 467.8bn | KRW 393.4bn | KRW 547.9bn | +17.1%; driven by loan and investment assets |
| Operating profit | KRW 96.8bn | KRW 91.3bn | KRW 127.9bn | +32.0%; direct sales and investment-finance fees |
| Net income | KRW 81.1bn | KRW 72.6bn | KRW 100.5bn | +23.8%; first KRW 100bn-plus net income year |
| Securities share | 11.4% | 12.2% | Not confirmed | Investment-finance portfolio expansion |
| NPLs | KRW 125.3bn, 3.26% | KRW 207.6bn, 4.82% | Not confirmed | Retail/SME weakness accompanying growth |
Net interest income stepped up
9M 2025 net interest income was KRW 205.4 billion, up 19.49% from KRW 171.9 billion a year earlier. 4Q asset growth supported interest revenue.
Investment-finance division effect
The investment-finance division, launched in early 2025, generated deal-sourcing fees, management fees and exit gains. 9M net fee income was KRW 25.8 billion, up 74.32% YoY.
Funding and credit-cost defense
The KRW 700 billion guarantee from the Military Mutual Aid Association helped funding costs, while the 3Q 2025 real-estate PF delinquency ratio was managed at 0%.
Official fact: At 3Q 2025, the portfolio was described as loans at 65.5%, about KRW 3.3 trillion, securities around KRW 603.3 billion, and installment finance at KRW 350.1 billion. The securities share increased 2.2 percentage points from the prior year.
Interpretation: Direct corporate finance, lower reliance on intermediaries, non-face-to-face lending platforms and AI-based credit scoring are attempts to improve both yield and screening speed.
2. 2026 durability: three scenarios
CEO Jung Sang-chul’s 2026 New Year message referenced a KRW 10 trillion asset target and expansion through M&A. From the current KRW 5.15 trillion asset base, that target would change the industry map, so the source uses interest rates, PF restructuring and NPLs as lead indicators.
Official fact: The company is working to move its A0 credit rating toward A+. The real-estate PF delinquency ratio was 0% at 3Q 2025, but total NPLs were KRW 207.6 billion and the NPL ratio was 4.82%, up 1.56 percentage points from 3.26% at end-2024.
Interpretation: Lower rates help funding costs, but 2026 PF restructuring and accumulated retail/SME stress are separate risks. The growth case requires evidence that NPLs can be contained in the high-4% range.
Base: controlled growth
- Logic: Investment-finance deal sourcing becomes a stable cash cow, funding spreads improve as rates decline, and NPLs are managed in the high-4% range through write-offs and NPL-fund sales.
- Earnings sensitivity: Assets grow 10-15% YoY to KRW 5.8tn-6.0tn, while annual net income stays in a stable KRW 100bn-110bn band.
- Key variables: Maintaining A0, visible A+ upgrade path and cleanup of credit-quality indicators through NPL sales.
Bull: M&A jump
- Logic: The M&A ambition in the New Year message becomes real, with the company acquiring a sound savings bank or specialized small capital company using parent support.
- Earnings sensitivity: Consolidated assets jump to KRW 7tn-8tn or more, moving closer to the KRW 10tn target. Early PMI costs may temporarily slow net margins.
- Key variables: Large parent-led third-party capital increase or additional trillion-won-scale perpetual securities. With capital of roughly KRW 730bn and an 8x leverage cap, major M&A is difficult using only internal capital.
Bear: PF and retail stress transmit
- Logic: The 2026 restructuring wave in second-tier financial real-estate PF transmits to the company, with bridge-loan EOD events and household-credit stress.
- Earnings sensitivity: The NPL ratio exceeds 6%, provisions increase sharply, operating profit halves and net income retreats to KRW 50bn-60bn. Asset growth stops due to leverage constraints.
- Key variables: Actual loss transmission from construction/real-estate exposure of about KRW 210.7bn, or 6.13%, and delinquency in multi-debtor personal loans.
3. What negative OCF means
Despite KRW 72.6 billion of 9M 2025 net income, operating cash flow was -KRW 419.5 billion. For a manufacturer, that could suggest poor cash conversion; for a capital company, loan growth itself is booked as operating cash outflow.
| Cash-flow item | Amount | Direction | Meaning |
|---|---|---|---|
| Net income | +KRW 72.6bn | Inflow | Accounting profit |
| Non-cash adjustments | -KRW 86.7bn | Outflow | Provision expense +KRW 93.9bn, depreciation/amortization +KRW 2.4bn, interest expense +KRW 137.0bn and interest income -KRW 340.6bn, among other accrual adjustments |
| Increase in loans | -KRW 443.4bn | Outflow | Cash used to originate new loans, evidence of growth |
| Investment-finance and other asset growth | -KRW 152.0bn | Outflow | FVTPL financial assets -KRW 94.9bn and installment finance -KRW 37.0bn, among other portfolio expansion items |
| Final OCF | -KRW 419.5bn | Net outflow | Large cash outflow despite profit |
Official fact: In 3Q 2025, the company generated financing cash flow of +KRW 370.1 billion through items including KRW 1.41 trillion of borrowings and KRW 1.34 trillion of bond issuance.
Interpretation: The negative OCF is not automatically weak cash flow; it is structurally linked to selling money as the product. The real question is whether the funded assets remain good credit assets in 2026.
4. Governance: moat and risk
Hankook Capital’s biggest defense is the Military Mutual Aid Association. The source views it as a funding and capital advantage versus peers, while also pointing out liquidity and shareholder-return discounts.
| Item | Figure/detail | Investment read-through |
|---|---|---|
| Controlling shareholder | Military Mutual Aid Association, 80.41%, 253,782,660 shares | Has controlled the company since the 2001 acquisition |
| Treasury shares | 2,759,001 shares, about 0.87% | Some changes related to management compensation |
| Perpetual support | KRW 50bn in 2021 and KRW 100bn in 2023, total KRW 150bn | Supports leverage regulation and capital adequacy |
| Guarantee line | KRW 700bn limit, KRW 345bn used at 3Q 2025 | Core tool for lowering funding costs at an A0-rated issuer |
| Free float | 18.72%, about 59.06 million shares | Low liquidity and institutional-entry discount |
| 2025 dividend | KRW 40/share, total about KRW 12.5bn, 4.8% yield | 14-year dividend streak is positive, but payout ratio is only about 12.4% of KRW 100.5bn net income |
The parent’s support is a clear funding-cost moat. But further growth toward KRW 10 trillion assets requires capital, and investors must model dilution or additional hybrid-capital terms.
5. Investment frame and risk triggers
| Criterion | Source view | Basis |
|---|---|---|
| Competitive advantage | S-grade | KRW 150bn of perpetuals and KRW 700bn guarantee capacity differentiate the company from smaller independent lenders facing funding crunch risk. |
| Earnings visibility | A-grade | 0% PF delinquency, AI-screened non-face-to-face lending and investment-finance fee income support a KRW 80bn-100bn annual earnings base. |
| Valuation | Deeply undervalued | At end-February 2026, the source cites market cap of about KRW 366.7bn, PER 3.94x, PBR 0.50x, ROE 12.77% and dividend yield 4.8%. |
| Macro backdrop | B+ | Lower rates can reduce funding costs and increase bond-portfolio value, but PF restructuring risk remains. |
| Risk-reward | Upside-skewed | The NPL increase is a weakness, but KRW 127.9bn of operating profit gives some buffer against near-term shocks. |
The source’s final rating is BUY over one year, through confirmation of 4Q 2026 results. The invalidation condition is an NPL ratio above 5.5%. The source would treat that as evidence that credit-quality control has broken down and would move to a more conservative HOLD stance.
Risk-trigger monitoring
| Risk | Trigger | Lead indicator | Response frame |
|---|---|---|---|
| Asset-quality deterioration | Long macro slowdown and more self-employed borrower failures | NPL ratio above 5.5% | Company: front-load provisions and sell NPLs. Investor: reduce exposure if credit cost spikes. |
| Leverage regulation | KRW 10tn asset target outpaces capital growth | Leverage ratio approaches 7.5x versus 8x cap | Company: parent-led capital increase or new hybrid securities. Investor: reflect dilution risk. |
| Second PF shock | Failures at smaller savings banks/capital firms and distressed PF auctions | PF exposure cleanup rate and EOD events in bridge loans | Company: conservative collateral revaluation and higher provisions. Investor: separate one-off provisioning from structural losses. |
| Low free float | Strong earnings but poor liquidity and stagnant flows | Daily traded value and foreign/institutional net buying | Company: treasury-share cancellation/swap or bonus issue. Investor: avoid short-term trading and consider dividend support. |
6. Fact-check table
| Claim | Evidence | Date | Reliability |
|---|---|---|---|
| Preliminary 2025 net income of KRW 100.5bn | Revenue/earnings structure change filing | 2026-03-05 | Highest, filing |
| Total assets reached KRW 5.15tn | Revenue/earnings structure change filing | 2026-03-05 | Highest, filing |
| Investment/corporate-finance non-interest income increased | 3Q report/Financial News | 2025-11 | High |
| Real-estate PF delinquency ratio at 0% | Financial News earnings review | 2025-11 | Medium-high |
| KRW 150bn perpetual support | 3Q report notes | 2025-11 | Highest, filing |
| NPLs of KRW 207.6bn, 4.82% | 3Q report | 2025-11 | Highest, filing |
| OCF of -KRW 419.5bn | 3Q consolidated cash-flow statement | 2025-11 | Highest, filing |
| Dividend of KRW 40 and 4.8% yield | Digital Today article citing filing | 2026-02-05 | High |
| KRW 10tn asset target and M&A intent | CEO 2026 New Year message | 2026-01-02 | Medium-high |
| Military Mutual Aid Association ownership of 80.41% | 3Q report | 2025-11 | Highest, filing |
Where recency conflicts exist, the analysis uses the March 5, 2026 preliminary filing for P&L and total assets, and the November 14, 2025 quarterly report for portfolio mix, OCF and NPL details.
Sources
- Original post: https://m.blog.naver.com/PostView.naver?blogId=star_of_self&logNo=224205835227
- Hankook Capital revenue/earnings structure change PDF: source attachment name
- Financial News 3Q 2025 earnings: https://www.fntimes.com/html/view.php?ud=2025111916400190336a663fbf34_18
- Bridgecode OCF glossary: https://mna.bridgecode.kr/blog/insight/ocf
- Valueline cash-flow statement: https://valueline.co.kr/finance/cashflow/023760
- CEO New Year message - Chosun Biz: https://biz.chosun.com/stock/finance/2026/01/02/3R72KSCKRJB6VDTWEWQ2J7367I/
- CEO New Year message - Daum Finance: https://m.finance.daum.net/quotes/A023760/news/stock/20260102144205104
- Savings-bank PF risk - Newstop: https://www.newstopkorea.com/news/articleView.html?idxno=42904
- Real-estate PF exposure newsroom: https://www.dbritz.kr/GeneralNews/?q=YToyOntzOjEyOiJrZXl3b3JkX3R5cGUiO3M6MzoiYWxsIjtzOjQ6InBhZ2UiO2k6MjczO30%3D&bmode=view&idx=161606007&t=board
- IB Tomato credit signal: https://www.ibtomato.com/mobile/mExternalView.aspx?no=4926&type=1
- KRW 50bn perpetual - Asia Economy CORE: https://core.asiae.co.kr/article/2021080908391814938
- KRW 50bn perpetual - Seoul Economic Daily: https://m.sedaily.com/amparticle/13150274
- KRW 100bn perpetual - Busan Financial News: https://busan.fnnews.com/news/202310301542268701
- KRW 40/share dividend - Digital Today: https://www.digitaltoday.co.kr/news/articleView.html?idxno=637554
- Hankook Capital company analysis - Jasoseol: https://jasoseol.com/companies/3437/insights
- Financial News 1H 2025 earnings: https://www.fntimes.com/html/view.php?ud=2025081816251967386a663fbf34_18
- CBRE Korea 2026 commercial real-estate outlook: https://www.cbrekorea.com/insights/reports/2026-%EA%B5%AD%EB%82%B4-%EC%83%81%EC%97%85%EC%9A%A9-%EB%B6%80%EB%8F%99%EC%82%B0-%EC%8B%9C%EC%9E%A5-%EC%A0%84%EB%A7%9D
- Real-estate PF round two - Newsian: http://www.newsian.co.kr/news/articleView.html?idxno=86249
- Mutual-finance PF loan cap - Changeui Accounting: https://changeui.co.kr/sub/insight/news.php?mode=view&bid=6&s_type&s_keyword&s_cate&idx=426&page=1
- Shareholders meeting notice - KRX: https://kind.krx.co.kr/external/2026/02/27/001469/20260227003187/00591.htm