DEEP RESEARCH · GRIDWIZ
Gridwiz: Local Energy Consumption and VPP Platform Operating Leverage
A review of 2025 preliminary earnings and the 3Q report, focused on platform revenue quality, cost structure and VPP catalysts.
0. Bottom line first
My key takeaway is that Gridwiz should not be read only as a solar EPC or EV-charger hardware company. The 2025 numbers point to an energy-software platform: 83% recurring revenue, 0.75GW of distributed resources, roughly 18,000 customers and a sharply improved cost base.
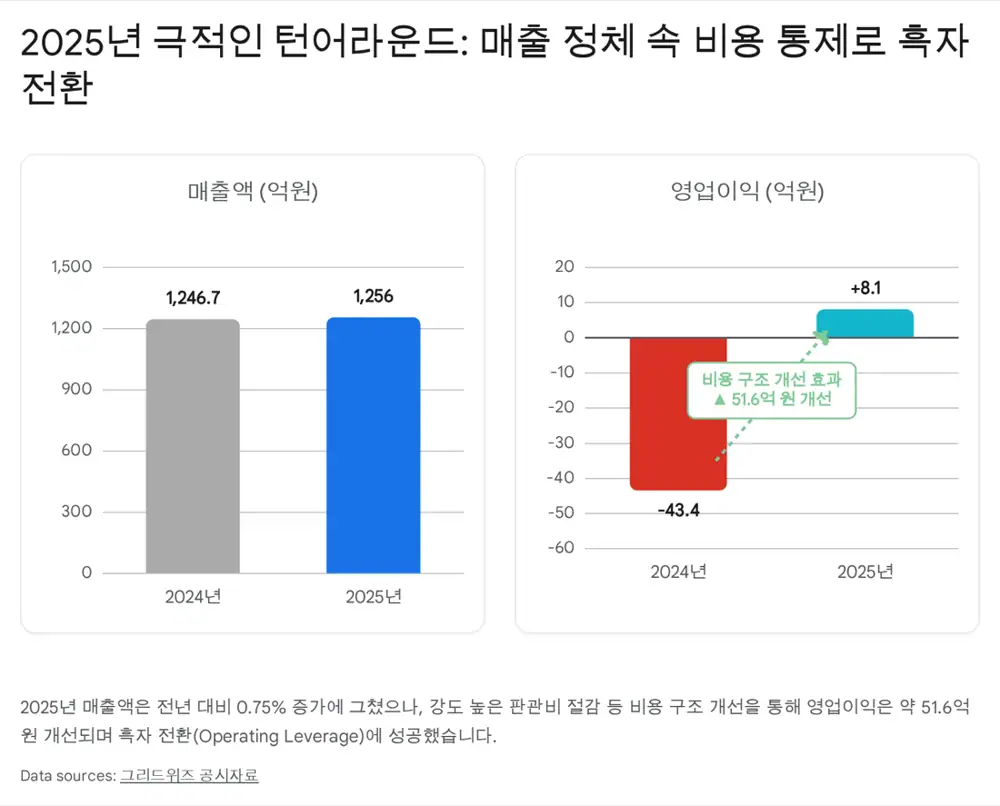
Official fact: Preliminary 2025 revenue was KRW 125,608,613,271, up 0.75% YoY. Operating profit turned positive from -KRW 4,342,600,272 to KRW 818,409,935. Net income was KRW 5,872,289,388, up 90.5% YoY.
Interpretation: Revenue was almost flat, but operating profit improved by KRW 5.16 billion. If the 2026 regional electricity-pricing regime and distributed-energy law translate into real demand, new VPP revenue could drop through a lower breakeven structure with meaningful operating leverage.
1. Business model and moat
The source argues that the market often assigns low multiples to energy-transition companies by treating them as solar installers or equipment vendors. Gridwiz’s core cash cow, however, is software and data-driven platform fees.
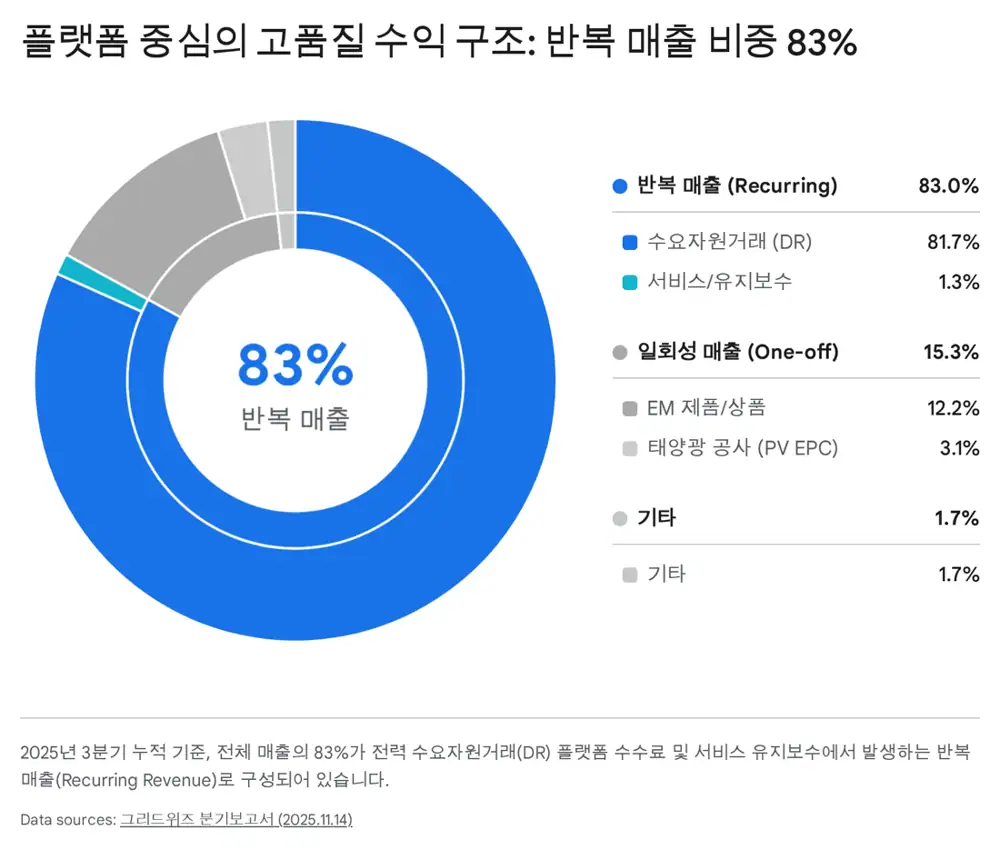
| Revenue type | Segment | 9M 2025 revenue | Share | 2024 share | Revenue nature |
|---|---|---|---|---|---|
| Demand-resource transaction revenue | DR power demand management | KRW 74,269,641 thousand | 81.7% | 87.0% | Recurring platform fee |
| Service revenue | EM, ESS, PV maintenance/operation | KRW 1,193,660 thousand | 1.3% | 2.8% | Recurring O&M |
| Product/merchandise revenue | EM EV communication modems and chargers | KRW 11,099,066 thousand | 12.2% | 6.4% | One-off infrastructure/hardware |
| Construction revenue | PV design and construction | KRW 2,835,211 thousand | 3.1% | 2.2% | One-off project/EPC |
| Renewables/other | Power sales and power-data management | KRW 1,545,392 thousand | 1.7% | 1.7% | Recurring/other |
| Total | All segments | KRW 90,942,970 thousand | 100.0% | 100.0% | - |
Official fact: DR revenue of 81.7% plus service revenue of 1.3% means roughly 83% of 9M 2025 revenue was recurring. EM product revenue rose from 6.4% of 2024 revenue to 12.2% in 9M 2025.
Interpretation: EVCC/SECC communication modems and smart chargers are not just devices. They are data-collection infrastructure for a future V2G ecosystem, meaning hardware sales can strengthen platform control.
No. 1 domestic DR operator
The source cites roughly 18,000 customers and 0.75GW of managed capacity, comparable to one nuclear reactor, as a key barrier to entry.
R&D and patents
9M 2025 R&D spending was KRW 1.86 billion, or 2.0% of revenue. The source references patents around optional power-demand control, meter time-difference management, AI-based distributed-idle resource safety management and digital twins.
DQ Class A
In September 2025, the energy-platform dataset received Class A, the top grade, from a nationally accredited data-quality certification body. The source ties that to power-market bidding reliability.
2. Distributed energy and VPP 2.0
The macro catalyst in the source is Korea’s Distributed Energy Activation Special Act, implemented in June 2024, and the expected regional electricity-rate system in 2026. The logic is that power-intensive companies in the Seoul metro area may need energy-control platforms to manage higher local electricity costs.
Official fact: The company’s business description covers power demand management, EV charging modems and chargers, ESS and solar installation/operation, overseas local production of EV charging modems and smart chargers, overseas V2G service development and a stated ambition to become the No. 1 VPP operating player.
Interpretation: Legacy DR pays customers to reduce power use. Future VPP connects solar panels, ESS assets and EV batteries through cloud software and controls them like a single power plant. The current 0.75GW DR base is the launchpad.
Official fact: At 3Q 2025, trade receivables were KRW 6.72 billion and the allowance for doubtful accounts was KRW 4.57 billion, a 68.0% allowance ratio.
Interpretation: A 68% allowance ratio looks heavy, but the source argues it is more likely tied to legacy PV EPC or B2B hardware receivables than to the core DR settlement stream, whose counterparty is close to the Korea Power Exchange. The loss has already been recognized, so any later recovery could be upside through allowance reversal.
3. Q, P and C behind the turnaround
| Item | 2024 | 2025 | Change | YoY |
|---|---|---|---|---|
| Revenue | KRW 124,674,395,185 | KRW 125,608,613,271 | +KRW 934,218,086 | +0.75% |
| Operating profit | -KRW 4,342,600,272 | KRW 818,409,935 | +KRW 5,161,010,207 | Turned positive |
| Pre-tax profit | -KRW 1,865,496,555 | KRW 3,306,046,332 | +KRW 5,171,542,887 | Turned positive |
| Net income | KRW 3,082,139,721 | KRW 5,872,289,388 | +KRW 2,790,149,667 | +90.5% |
Volume resilience
Revenue still grew 0.75% despite weak solar and ESS construction. The source credits recurring DR fees from ~18,000 customers and 0.75GW of capacity.
Price/margin defense
Maintaining a high DR platform and control-software mix reduces direct exposure to raw-material inflation and low-cost hardware competition.
Cost restructuring
The filing attributes the profit improvement to lower SG&A and a better cost structure. Revenue rose only KRW 0.93 billion, while operating profit improved KRW 5.16 billion.
4. Cash flow and capital allocation
Official fact: 9M 2025 consolidated net income was KRW 6.42 billion, while operating cash flow was KRW 8.88 billion. Non-cash expenses included KRW 1.58 billion of intangible amortization, KRW 1.02 billion of depreciation and KRW 1.00 billion of right-of-use asset depreciation.
Interpretation: This is not a paper-profit story with weak cash collection. The source sees the cash flow as confirmation of the B2B platform model’s collection quality.
| Balance-sheet/capital item | Figure | Read-through |
|---|---|---|
| Cash and cash equivalents | KRW 57.88 billion | Liquidity buffer against delayed front-end investment |
| Short-term borrowings | KRW 0.91 billion | Limited interest-bearing debt burden |
| Total current liabilities | KRW 39.2 billion | Even after hypothetical full repayment, KRW 18.6 billion of cash remains |
| Financial income | KRW 4.99 billion | Cash management and fair-value gains on financial assets |
| PP&E acquisition | KRW 4.98 billion | CAPEX for equipment replacement and infrastructure |
| Trident AI PE investment | KRW 10.0 billion, 90.1% stake | Newly consolidated in 3Q 2025; interpreted as a vehicle for AI-based VPP forecasting and bidding capabilities |
5. Catalysts and final decision frame
The source believes the market is mispricing Gridwiz as a hardware/EPC company. Its core identity is closer to an energy-software company controlling B2B power assets and earning monthly fees. The rerating case rests on Class A data certification, roughly 18,000 customers, KRW 57.8 billion of cash-like assets and the 2025 turnaround.
Key catalysts
- 2026 regional electricity pricing and full implementation of distributed-energy rules could stimulate energy-efficiency demand among power-intensive metro-area companies.
- Operating leverage: with the breakeven point lowered, incremental VPP revenue could carry high profit conversion.
- Global V2G and BESS platform exports: the source cites overseas local production of smart EV chargers, overseas V2G-market development and BESS operating-platform export contracts with global companies such as Australia’s EVO Power.
The original author’s conclusion is highly aggressive. My practical frame is to monitor whether the 83% recurring revenue mix, KRW 57.8 billion cash base, KRW 5.16 billion operating-profit improvement and 0.75GW DR base actually connect to the 2026 VPP catalyst.
Sources
- Original post: https://m.blog.naver.com/PostView.naver?blogId=star_of_self&logNo=224200599646
- VPP beneficiaries and regional pricing: https://newsjjin.com/vpp-market-regional-pricing-strategy/
- Kookje article on regional electricity pricing: https://www.kookje.co.kr/news2011/asp/newsbody.asp?code=0200&key=20240522.99099006641
- Daum article on 2026 regional pricing: https://v.daum.net/v/20240523070900687
- KDI Nara Economy VPP article: https://eiec.kdi.re.kr/publish/naraView.do?fcode=00002000040000100001&cidx=14864
- Gridwiz 453450 Daum Finance: https://m.finance.daum.net/quotes/A453450/news/stock/20240905184252722
- VPP report: https://www.kbfg.com/kbresearch/cmm/fms/FileDown.do?atchFileId=FILE_000000002001242&fileSn=0
- Electimes on Gridwiz VPP/V2G: https://www.electimes.com/news/articleView.html?idxno=348931
- SK eNews distributed-energy direction: https://www.skenews.kr/news/articleView.html?idxno=51336