DEEP RESEARCH · DELL TECHNOLOGIES (DELL) / AI INFRASTRUCTURE
Dell Technologies: Structural Shift in AI Infrastructure and the Hardware Renaissance — an Asymmetric Buy
Q4 FY26 earnings beat, $43B AI backlog, dynamic pricing, and a -32-day CCC set up a sharp multiple re-rating
0. Bottom line first
Dell's Q4 FY26 result is not a one-off hardware peak — it is hard evidence that IT infrastructure has entered a "structural renaissance." Revenue $33.379B (+39% YoY), Non-GAAP diluted EPS $3.89 (+45%), full-year adjusted FCF $11.508B (+272%), and AI server backlog of $43B. The market still treats Dell as a "box assembler" and prices the stock at 9–11x forward P/E. Applying a sensible 15–18x to FY27 EPS guidance of $12.90 implies a fair-value band of $190–$230. Strong Buy.
1. Summary and investment thesis
Capital markets have long viewed hardware assemblers and IT infrastructure vendors as a low-value-added industry — limited FCF, margin compression at the hands of chipmakers. Dell's Q4 FY26 print and the wider industry data prove that view is fundamentally wrong: IT infrastructure has moved beyond a refresh cycle into a "structural renaissance."
4Q total revenue $33.379B (+39% YoY), GAAP operating income $3.092B (+43%). Non-GAAP diluted EPS $3.89 (+45%), far above consensus. FY26 cumulative revenue $113.538B (+19%), adjusted FCF $11.508B (+272%) — unprecedented cash generation.
This is no one-off. It reflects ① the explosive worldwide adoption of AI infrastructure, ② surging high-value storage demand driven by Agentic AI, ③ full modernization of legacy data centers, and ④ overwhelming global SCM-driven margin defense. With an AI server backlog of $43B at quarter end and a policy of returning more than 80% of FCF to shareholders, the current ~10–15x forward P/E is severely undervalued.
2. Company overview and intrinsic moat
2.1. Breaking the misconception: system-level monetization + storage attach
The market labels Dell a "pass-through" vendor assembling Nvidia/AMD parts with thin margin. Yet ISG (Infrastructure Solutions Group) Q4 operating margin came in at 14.8%, up 240 bps from 12.4% in the prior quarter. ISG Q4 OP was $2.9B (+41% YoY), the seventh straight quarter of double-digit growth. The driver is not the standalone AI-server hardware margin — it is the attach of high-margin Dell-IP storage, networking and services bundled with AI servers.
| ISG financial metric | Q4 FY25 | Q4 FY26 | FY26 full year | Implication |
|---|---|---|---|---|
| ISG total revenue | $11,352M | $19,602M | $60,826M | Top-line expansion driven by AI server volumes |
| AI-optimized server revenue | $2,026M | $8,952M | $24,683M | +342% quarterly, +166% annually — disruptive growth |
| Traditional server & networking | $4,608M | $5,853M | $19,512M | Modernization demand kicking in (+27%) |
| Storage revenue | $4,718M | $4,797M | $16,631M | High-margin Dell IP attach expansion |
| ISG operating income | $2,051M | $2,900M | $7,111M | +240bps margin uplift from storage mix |
As the AI center of gravity moves from hyperscaler training farms to enterprise rollouts, the importance of storage explodes. PowerStore, PowerScale and PowerMax delivered $4.797B in Q4 (+2% YoY); the all-flash array line grew double digits for the third straight quarter. PowerStore grew for the eighth consecutive quarter, and 30% of new customers were first-time Dell storage adopters.
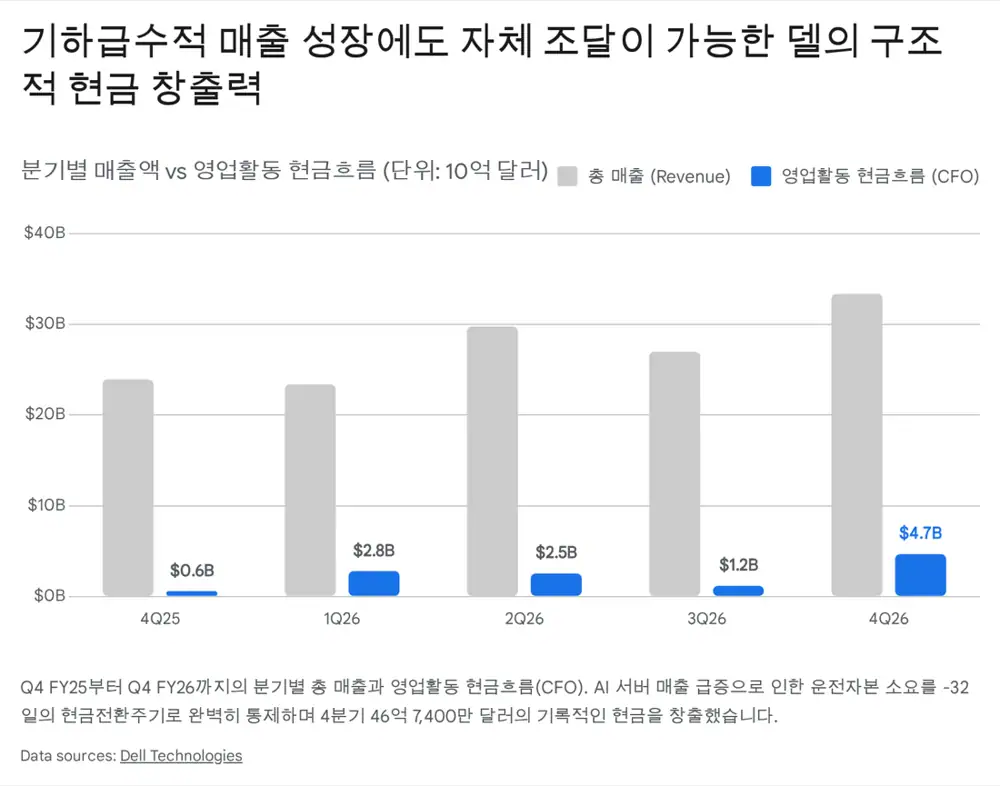
2.2. The negative-CCC magic
Amid HBM, DRAM and enterprise-NAND price spikes, Dell's overwhelming global purchasing power and long-term partnerships delivered best-in-class SCM. The Q4 cash conversion cycle was -32 days — Dell collects from customers a month before paying suppliers. Even with AI server revenue growing more than 4x YoY, working capital does not eat the company; growth is self-funded.
2.3. Direct sales and enterprise/sovereign-AI dominance
Super Micro (SMCI) once held about 80% of AI-server share in 2022 by relying on liquid cooling and time-to-market, but lacking installation, maintenance and accounting controls, its share has fallen to below 40% in 2026. Dell, by contrast, deploys integrated racks (IR9000/7000/5000) at 4,000+ enterprise AI customers with 24/7/365 on-site service. That end-to-end capability is the decisive reason Dell beats HPE and Lenovo for sovereign-AI projects in Europe, Japan and the Middle East where data sovereignty is a national strategy.
3. End-market deep dive
3.1. AI model evolution: training to Agentic AI and massive inference
Per JLL, inference workloads will overtake training in total AI infrastructure demand by 2027. Agentic AI demands multi-step reasoning, external tool orchestration and long context memory; KV cache rapidly exhausts GPU VRAM, forcing high-speed I/O between nodes and innovative storage architectures.
Dell counters this with its in-house parallel file system Project Lightning and PowerScale portfolio. At SC2025 and other venues, Dell reported up to 2x throughput vs. competing file systems, supplying parallel pNFS data to tens of thousands of GPUs without latency. With RDMA-based high-speed transfer and an LMCache offload engine, Dell storage is no longer a passive store but an "active participant" accelerating inference — defending against VAST Data and Weka and emerging as the de-facto standard in enterprise AI storage.
3.2. Sovereign AI's rapid rise
"Without infrastructure, there is no AI strategy" — the consensus has gone global. From Japan's SoftBank national projects to US national labs and state governments and India's national data-platform modernization, the Dell AI Factory with NVIDIA pulls in multibillion-dollar turn-key deals. An open ecosystem plus full compliance with local data regulations makes Dell the first choice for governments hedging geopolitical risk.
3.3. The economics of legacy data-center modernization
The traditional x86 server market is rebounding hard. Q4 traditional server & networking revenue was $5.853B (+27% YoY). Cost control, cybersecurity threats and data-governance pressures are accelerating hybrid-cloud adoption and on-premises refresh. Upgrading 5–7-year-old Gen-14 (or older) servers to Gen 16/17 enables 7:1 consolidation, cutting power by up to 65% and dramatically reducing software per-core licensing — a massive ROI. Under global grid constraints, the rollout of hybrid liquid-cooled IRSS systems will support Dell's traditional infrastructure for the next 3–5 years. CSG (PC) benefits from Windows 10 EOL (2H2025), with Q4 commercial revenue +16% and share gains.
4. Q, P, C deep dive
4.1. Quantity (Q): massive backlog, commanding guidance
Dell booked $34.1B of AI server orders in just three months, ending the fiscal year with a backlog of $43B. FY26 cumulative AI orders reached $64.1B. Even after shipping ~$9.5B per quarter, the five-quarter pipeline expanded vs. the prior quarter. Management guided FY27 AI-optimized server revenue to $50B (+100% YoY). Grace Blackwell systems begin shipping in 1Q; Vera Rubin/NVL72 enter the pipeline in 2H. CSG unit growth ran +18%, above the industry's ~10%.
4.2. Price (P): dynamic pricing proves pricing power
Over the past six months, generic DRAM spot prices have risen about 5.5x and enterprise NAND about 4x. Cisco and Lenovo warned of margin erosion. Dell did the opposite — turning the crisis into an upgrade for its pricing policy. It shortened quote validity, simplified promos, and moved to a "discount-off-list" model — full-fledged dynamic pricing. ISG raised prices on Dec 10; CSG followed on Jan 6. Customers responded with pull-forward orders, and margins normalized from Jan 6 onward — proof that Dell can pass component-cost inflation through to global customers.
4.3. Cost (C): internal innovation drives extreme operating leverage
Q4 FY26 Non-GAAP OpEx ratio came in at 9.9%, down 320 bps YoY from 13.1%. With revenue surging 39% past $33B, holding absolute OpEx in check is the result of AI-driven internal automation and disciplined skilling. Management guided FY27 OpEx growth to low single digits.
| Q, P, C | FY26 key results | FY27 outlook & structural impact |
|---|---|---|
| Quantity (Q) | AI orders $64.1B; cumulative backlog $43B | AI server guidance $50B (+100%). Blackwell & Rubin in volume — unprecedented expansion |
| Price (P) | DRAM +5.5x but dynamic pricing pushed ASPs higher | Pricing power validated; margin spread may widen if component prices ease |
| Cost (C) | Q4 OpEx ratio 9.9% (YoY -320bps) | Ongoing AI automation minimizes FY27 cost growth; extreme operating leverage |
5. Balance sheet and capital allocation
5.1. Record cash generation and overwhelming shareholder returns
FY26 CFO totaled $11.185B (+147%); adjusted FCF $11.508B. The -32-day CCC converts book income into ferocious cash. FY26 total shareholder return reached $7.5B ($6B buybacks + $1.5B dividends) — buybacks more than doubled YoY. Alongside this print, Dell raised the quarterly dividend +20% (annual $2.52/share) and authorized a new $10B buyback, exceeding the long-term framework of returning more than 80% of FCF.
5.2. Rock-solid balance sheet
Cash and equivalents of $11.528B at end-Q4 FY26, with total available liquidity above $13.3B including short-term investments. Core leverage ratio (ex-DFS) is 1.4x, comfortably below the long-term internal target of 1.5x. All three major rating agencies keep Dell at investment grade — the last line of defense if macro uncertainty or higher-for-longer rates bite.
6. Valuation and final conclusion
6.1. Strong outlook meets an irrational market discount
Management's FY27 guidance: annual revenue $140B (+23%), Non-GAAP diluted EPS $12.90 (+25%) — completely beyond the prior consensus around $10.00–$11.50, a disruptive earnings-surprise trajectory. With shares assumed to trade in $120–$148, forward P/E on guided $12.90 EPS sits at just 9.3–11.4x — less than half the S&P 500 IT sector average of about 23x — a deep-value disconnect.
The discount is sustained by two blind biases: ① the outdated view of Dell as a slow-growing consumer-PC dinosaur, and ② the misperception that AI-server revenue is "low-margin pass-through" because Nvidia captures all the value. The evidence proves both wrong — ① ISG margin defense at 14.8%, ② an unprecedented OpEx ratio of 9.9% delivering operating leverage, and ③ a sovereign-AI hegemony SMCI and HPE cannot crack.
| Peer comparison | Dell (DELL) | Super Micro (SMCI) | HPE | Valuation argument |
|---|---|---|---|---|
| Business model | End-to-end AI factory + enterprise IT solutions | Initial-volume AI server assembly | Private AI, networking (Juniper acquisition focus) | Dell's integrated solutions command negotiating power |
| Margin defense & value-add | High-margin storage attach + global services | Price competition; accounting issues & service gaps | Legacy dependence; networking synergies unproven | Storage + software + services margin underpin Dell's dominance |
| Valuation (P/E) | Forward 9–11x deeply undervalued | Risk-premium discount | Low multiple on low growth | Structural profit growth — urgent re-rating for Dell |
6.2. Specific catalysts for multiple expansion
- FY27 Q1 AI server revenue of $13B: A single quarter equaling half of FY26's annual run-rate. Overwhelming numbers can trigger short-covering.
- Dynamic pricing in full effect + CSG rebound: Jan 6 PC price increases and discount control flow fully through 1Q, driving a CSG margin rebound.
- Blackwell & Rubin cycle: 2H next-gen chip rollouts peak bundle sales of liquid-cooled IRSS plus Project Lightning storage.
- $10B buyback black hole: Continuous absorption of sell-side flow shrinks the float, structurally pumping quarterly EPS.
6.3. Final investment view
From a value investor's perspective, Dell sits at the rare intersection of explosive top-line growth and an irrationally depressed price — a true asymmetric risk-reward opportunity. The market should re-rate the company not as a slow hardware box-assembler but as the monopolistic integrated platform that designs and maintains national sovereign AI and Fortune-500 enterprise AI factories end-to-end.
Reflecting the relentless FCF generation and a structurally rising EPS path over the coming years, applying a conservative peer-average forward P/E of 15–18x to guided EPS of $12.90 implies a fair-value band of $190–$230. We initiate at Strong Buy. The current setup — just before mass investors awaken to the transformation of intrinsic value and the earnings paradigm shift — is the once-in-a-cycle window to maximize position size.
Sources
- Original Naver Blog post: https://m.blog.naver.com/PostView.naver?blogId=star_of_self&logNo=224199225938
- Live Earnings: Dell Q4 - 24/7 Wall St: https://247wallst.com/investing/2026/02/26/live-earnings-will-dell-technologies-dell-spike-after-q4-results/
- AI hardware wafer-thin margins - TechRadar: https://www.techradar.com/pro/the-dirty-little-secret-about-ai-hardware-that-you-should-know-about-server-vendors-have-to-wrestle-with-wafer-thin-margins-and-bigger-customers
- Selling AI servers - Next Platform: https://www.nextplatform.com/2025/02/28/the-only-thing-worse-than-selling-ai-servers-is-not-selling-them/
- Dell Shares +12% AI Server $9B - Chronicle Journal: http://markets.chroniclejournal.com/chroniclejournal/article/marketminute-2026-2-27-dell-shares-skyrocket-12-as-ai-server-revenue-hits-record-9-billion
- AI Infrastructure King Dell $50B: http://markets.chroniclejournal.com/chroniclejournal/article/finterra-2026-2-27-the-ai-infrastructure-king-a-deep-dive-into-dell-technologies-50-billion-transformation
- Dell Stock Soars - Evrim Agaci: https://evrimagaci.org/gpt/dell-stock-soars-amid-ai-boom-and-supply-crunch-531849
- Dell Q4 Earnings Beat - MLQ.ai: https://mlq.ai/news/dell-technologies-reports-strong-q4-earnings-beat-with-massive-ai-server-growth/
- Intel + SambaNova - Futurum Group: https://futurumgroup.com/insights/intel-bets-on-agentic-ai-economics-with-sambanova-partnership/
- Dell $29.8B AI Bet - CAIO Blog: https://chiefaiofficer.com/blog/how-dells-29-8-billion-ai-infrastructure-bet-delivered-32-profit-surge-and-market-leadership/
- Is Dell Pricing Reflecting Cash Flow - Simply Wall St: https://simplywall.st/stocks/us/tech/nyse-dell/dell-technologies/news/is-dell-technologies-dell-pricing-reflecting-its-cash-flow-s
- Dell Stock +85% in a Year - TIKR: https://www.tikr.com/blog/dell-technologies-stock-is-up-85-over-the-past-year-heres-whats-driving-the-ai-server-boom-in-2026
- Dell AI Wave $43B Backlog - Finviz: https://finviz.com/news/325413/dell-rides-an-ai-wave-analyst-cites-43-billion-order-backlog
- Dell Accelerates Enterprise AI - Dell Newsroom: https://www.dell.com/en-us/dt/corporate/newsroom/announcements/detailpage.press-releases~usa~2025~11~dell-technologies-accelerates-enterprise-ai-with-powerful-automated-solutions.htm
- Dell Q4 2026 Earnings Call Transcript - Motley Fool: https://www.fool.com/earnings/call-transcripts/2026/02/26/dell-dell-q4-2026-earnings-call-transcript/
- Primary Storage in 2026 - WWT: https://www.wwt.com/blog/primary-storage-in-2026-trends-priorities-and-strategic-shifts
- Storage shortage AI delays - Network World: https://www.networkworld.com/article/4119287/storage-shortage-may-cause-ai-delays-for-enterprises.html
- BofA cuts Dell target - Investing.com: https://www.investing.com/news/analyst-ratings/bofa-cuts-dell-stock-price-target-on-memory-cost-headwinds-93CH-4518428
- DELL stock - Perplexity Finance: https://www.perplexity.ai/finance/DELL
- Dell $50B Transformation - Times Online: http://business.times-online.com/times-online/article/finterra-2026-2-27-the-ai-infrastructure-king-a-deep-dive-into-dell-technologies-50-billion-transformation
- Dell $18.4B backlog discussion - Reddit r/investing: https://www.reddit.com/r/investing/comments/1rf0fhh/dell_reports_tomorrow_with_a_184b_backlog_and_the/
- Power, Policy & AI 2026 - Dell Blog: https://www.dell.com/en-us/blog/power-policy-ai-the-rules-of-the-race-in-2026/
- Goldman Sachs Sell on SMCI - Fintool: https://fintool.com/news/goldman-smci-sell-margin-erosion
- Architect of AI Factory - FinancialContent: https://markets.financialcontent.com/stocks/article/finterra-2026-2-26-the-architect-of-the-ai-factory-a-deep-dive-into-dell-technologies-dell-as-ai-demand-surges
- SMCI DCBBS - Nasdaq: https://www.nasdaq.com/articles/smci-doubles-down-dcbbs-it-next-growth-engine
- Dell Sovereign AI Whitepaper: https://www.delltechnologies.com/asset/en-us/solutions/business-solutions/industry-market/dell-sovereign-ai-whitepaper-apj.pdf
- Reflections from Europe Sovereign AI - Dell: https://www.dell.com/en-us/blog/reflections-from-europe-sovereign-ai-is-powering-up/
- AWS Evaluating AI Agents: https://aws.amazon.com/blogs/machine-learning/evaluating-ai-agents-real-world-lessons-from-building-agentic-systems-at-amazon/
- AI in 2026 - SambaNova: https://sambanova.ai/blog/ai-trends-2026-insights
- 2026 Global Data Center Outlook - JLL: https://www.jll.com/en-us/insights/market-outlook/data-center-outlook
- Agentic AI memory architecture - AI News: https://www.artificialintelligence-news.com/news/agentic-ai-scaling-requires-new-memory-architecture/
- VRAM in Agentic AI - AWS Builder Center: https://builder.aws.com/content/31Yeh8Jz9yCtgz9uL6lseoUQpLB/vram-requirements-in-agentic-ai-systems-a-comprehensive-guide
- VAST Data Agentic AI OS - StorageReview: https://www.storagereview.com/news/vast-data-unveils-agentic-ai-os-and-advances-its-thinking-machine-vision
- Heterogeneous Computing - arXiv: https://arxiv.org/html/2601.22001v1
- Agentic AI in the Factory - NVIDIA: https://docs.nvidia.com/ai-enterprise/planning-resource/ai-factory-white-paper/latest/agentic-ai-in-the-factory.html
- KV Cache Offloading with Dell AI Storage Engines: https://infohub.delltechnologies.com/en-us/p/from-bottleneck-to-breakthrough-scalable-kv-cache-offloading-with-dell-ai-storage-engines/?hve=Read+the+white+paper
- PowerScale ObjectScale Innovation - Dell Blog: https://www.dell.com/en-us/blog/powerscale-objectscale-innovation-storage-that-delivers/
- Dell AI-Centric Infrastructure - HPC Wire: https://www.hpcwire.com/bigdatawire/this-just-in/dell-unveils-ai-centric-infrastructure-with-new-cooling-storage-and-server-innovations/
- PowerScale with pNFS - Dell Blog: https://www.dell.com/en-us/blog/dell-powerscale-with-pnfs-parallel-performance-for-ai/
- Project Lightning PowerScale - Blocks and Files: https://www.blocksandfiles.com/ai-ml/2025/08/26/project-lightning-brings-parallel-performance-boost-to-dell-powerscale/1588297
- Dell Storage Engines Accelerating AI inferencing: https://www.dell.com/en-us/blog/dell-storage-engines-accelerating-ai-inferencing-with-powerscale-and-objectscale/
- AI storage services - NetApp: https://www.netapp.com/learn/ai-storage-service-options/
- VAST vs Weka HPC - Reddit r/HPC: https://www.reddit.com/r/HPC/comments/18mwvgq/eli5_vast_vs_weka_hpc_deep_learning/
- NVIDIA America's AI Infrastructure: https://nvidianews.nvidia.com/news/nvidia-partners-ai-infrastructure-america
- Security, Sovereignty and Skills - Dell Blog: https://www.dell.com/en-us/blog/from-policy-to-outcomes-security-sovereignty-and-skills/
- Shaping the Future with AI - Dell Blog: https://www.dell.com/en-us/blog/shaping-the-future-with-ai-dell-s-vision-in-action/
- Dell AI India Blueprint - Economic Times: https://m.economictimes.com/tech/technology/dell-unveils-ai-india-blueprint-to-scale-sovereign-trusted-ai-nationwide/articleshow/128606348.cms
- State and Local Government Partnerships - Dell Blog: https://www.dell.com/en-us/blog/strategic-partnerships-that-move-state-and-local-government-forward/
- Enterprise Demand Fueling Dell - Dell Blog: https://www.dell.com/en-us/blog/enterprise-demand-is-fueling-dell-s-ai-infrastructure-leadership/
- PowerEdge Rack Servers - Dell Blog: https://www.dell.com/en-us/blog/rapidly-evolve-business-operations-with-poweredge-rack-servers/
- PowerEdge Server Cooling: https://infohub.delltechnologies.com/de-de/p/dell-poweredge-server-cooling-choose-the-cooling-options-that-match-the-needs-of-you-and-your-workloads/
- Dell Cooling and Computing for AI - Dell Blog: https://www.dell.com/en-us/blog/power-future-ai-dell-cooling-servers/
- NVIDIA Rubin Platform CES 2026: https://blogs.nvidia.com/blog/2026-ces-special-presentation/
- NVIDIA Rubin Six New Chips: https://nvidianews.nvidia.com/news/rubin-platform-ai-supercomputer
- JP Morgan Nvidia Vera Rubin - Tom's Hardware: https://www.tomshardware.com/tech-industry/artificial-intelligence/jp-morgan-says-nvidia-is-gearing-up-to-sell-entire-ai-servers-instead-of-just-ai-gpus-and-componentry-jensens-master-plan-of-vertical-integration-will-boost-profits-purportedly-starting-with-vera-rubin
- Zacks DELL HPE Cisco SMCI - Finviz: https://finviz.com/news/322044/the-zacks-analyst-blog-highlights-dell-hewlett-packard-cisco-systems-and-super-micro-computers
- Dell Q4 2026 transcript - Investing.com: https://www.investing.com/news/transcripts/earnings-call-transcript-dell-technologies-q4-2026-beats-expectations-with-record-earnings-93CH-4530107
- Dell Record High - StocksToTrade: https://stockstotrade.com/news/dell-technologies-inc-class-c-dell-news-2026_02_27-3/
- Assessing Dell Valuation - Simply Wall St: https://simplywall.st/stocks/us/tech/nyse-dell/dell-technologies/news/assessing-dell-technologies-dell-valuation-after-record-ai-d
- DELL vs HPE - Tickeron: https://tickeron.com/compare/DELL-vs-HPE/
- DELL vs SMCI - Nasdaq: https://www.nasdaq.com/articles/dell-vs-smci-which-ai-server-stock-offers-better-growth-opportunity