DEEP RESEARCH · ZIM/CONTAINER SHIPPING
ZIM: War Premium and the Convexity of an Asset-Light Model
A high-beta shipping structure built on the Red Sea crisis, chartered fleet, LNG newbuilds, and variable dividends
0. Bottom line first
ZIM is less a long-term compounding shipping stock and more a tactical instrument levered to the Red Sea crisis and spot-freight volatility. I read the core structure as: if chaos persists, cash flows; if peace arrives, the trade ends.
1. Asset-light cuts both ways: charter model and cost threshold
ZIM's identity is the asset-light model. While peers own vessels directly, ZIM leases about 90% of its operating fleet. This turns shipbuilding CAPEX into charter hire operating cost and, in bull markets, enables fast capacity deployment and profit capture.
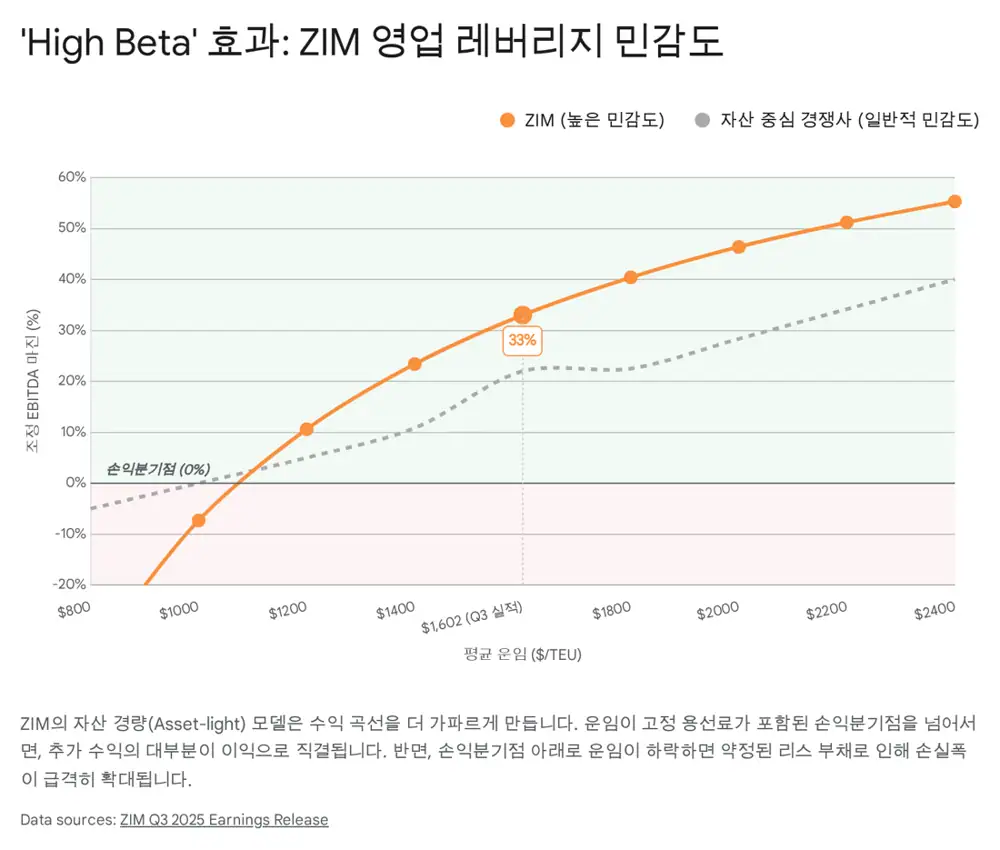
Interpretation: The problem is duration mismatch. If ZIM signs three- to five-year charters at high rates during a boom and spot rates then collapse, it carries fixed lease liabilities above the market rate and margins deteriorate quickly.
| Item | Source number | Meaning |
|---|---|---|
| Operating fleet | 129 vessels as of 3Q25 | Base unit of the network |
| LNG-powered vessels | About 40% | Better fuel economics and environmental compliance |
| Newbuild vessels | About 60% | Source of lower slot cost |
| Long-term LNG charters | 28 vessels, up to 12 years | Greener, lower-cost fleet transition |
| Additional contracts | 10 LNG vessels of 11,500 TEU, delivered from 2H27 to 2028 | Medium-term cost-structure improvement |
Backing out the 3Q25 numbers, average freight was USD 1,602 per TEU, total operating costs plus depreciation were about USD 1.46 billion for the quarter, and carried volume was 926,000 TEU. The source estimates ZIM's total cost per TEU at roughly USD 1,550-1,580. 3Q25 adjusted EBIT margin was 15%, with adjusted EBIT of USD 260 million.
Official fact: 3Q25 depreciation of USD 292 million is mostly amortization of right-of-use assets, effectively lease cost. Although it looks like non-cash accounting expense, the source treats it as a proxy for fixed cash outflow over the contract period.
2. Red Sea crisis: the pillar of ZIM valuation
Houthi attacks on commercial vessels made Bab el-Mandeb transit difficult and forced container ships around the Cape of Good Hope. This rerouting adds about 3,500 nautical miles to Asia-Europe and Asia-U.S. East Coast routes and extends sailing time by 10-14 days.
Capacity absorption
Maintaining the same weekly service requires more ships per loop, absorbing part of newbuild oversupply.
Israeli carrier
ZIM is described as a direct priority target for the Houthis, making Suez return harder.
War premium
Rerouting raises cost, but it also supports premium freight on affected routes.
Official fact: The source says Maersk and CMA CGM attempted to return to the Suez Canal in early 2026 but withdrew or rerouted services after renewed threats. Based on January 2026 Xeneta and Drewry data, spot rates had fallen from peaks but remained above pre-crisis levels.
Interpretation: ZIM's biggest threat is, ironically, peace. The global container orderbook is presented at about 31% of existing capacity; if the Red Sea reopens, capacity absorbed by the long route returns to the market. The source says spot rates could fall 40-60% within weeks, and points to ZIM's past 17-18% share-price drops on ceasefire headlines as evidence of this risk.
ZIM also carries higher war-risk insurance costs. It passes some of this to customers through USD 50-120 per TEU surcharges, but its base cost remains higher than peers. Operational constraints such as Turkey's ban on Israeli vessel calls create additional friction by forcing route changes or skipped ports.
3. 3Q25 earnings and balance sheet
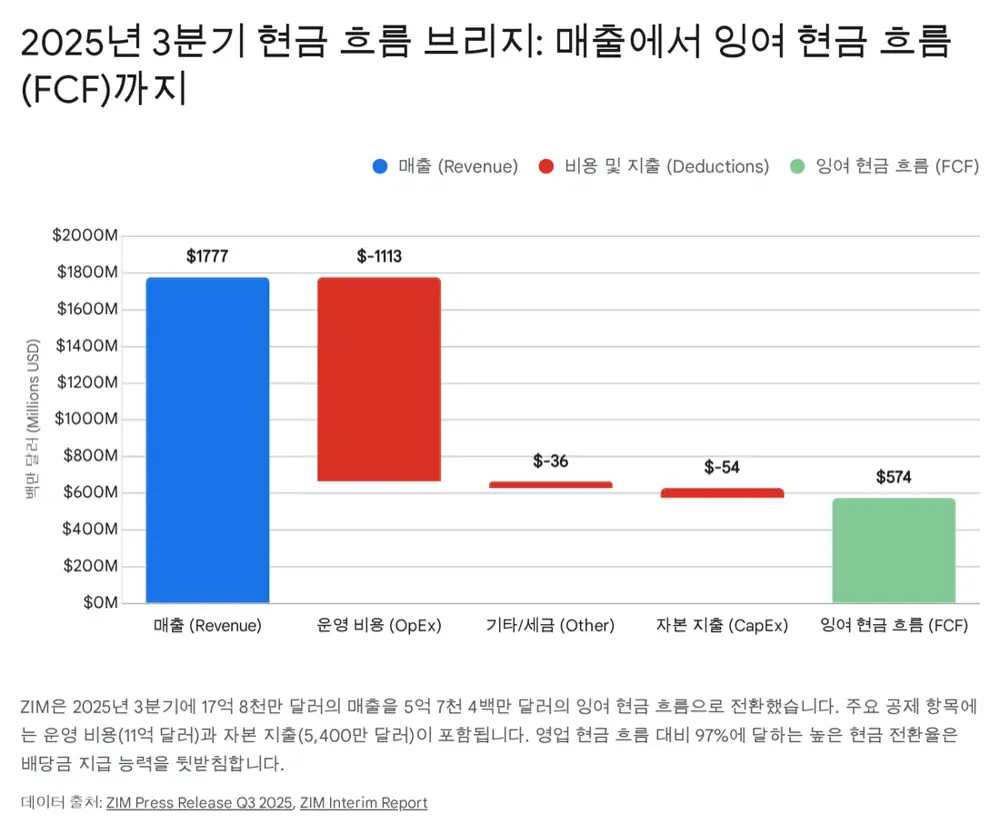
Official fact: ZIM's 3Q25 revenue was USD 1.777 billion, down 36% year over year. Adjusted EBITDA was USD 593 million with a 33% margin, and net income was USD 123 million.
| Metric | 3Q24 | 3Q25 | YoY | 9M24 | 9M25 |
|---|---|---|---|---|---|
| Carried volume, k TEU | 970 | 926 | -5% | 2,768 | 2,765 |
| Average freight, $/TEU | $2,480 | $1,602 | -35% | $1,889 | $1,622 |
| Revenue, $M | $2,765 | $1,777 | -36% | $6,260 | $5,419 |
| Adjusted EBITDA, $M | $1,531 | $593 | -61% | $2,725 | $1,844 |
| Adjusted EBIT, $M | $1,236 | $260 | -79% | $1,891 | $872 |
| Net debt, $M | N/A | $2,642 | N/A | N/A | $2,642 |
Headline debt looks high at USD 5.65 billion, but the source says about USD 5.57 billion is lease liabilities, while actual bank loans and other financial debt are only about USD 108 million. Cash and investments are about USD 3.0 billion, net debt is USD 2.64 billion, and net leverage is 0.9x.
Interpretation: Liquidity is ample, but lease obligations cannot be reduced like bank debt through early repayment. Downcycle resilience comes from cash, while profitability pressure comes from fixed lease cost.
4. Dividends and commercial strategy
ZIM maintains a variable dividend policy of distributing 30-50% of annual net income. The 3Q25 dividend was USD 0.31 per share, or USD 37 million in total, equal to 30% of quarterly net income. The source warns that if freight collapses to USD 1,200 per TEU, EPS could turn negative and the dividend could stop immediately.
| Scenario | Expected net income | Payout | Expected dividend | Yield, assuming ~$23 stock | After-tax yield, 25% tax |
|---|---|---|---|---|---|
| Bear, peace | $0-$200M | 30% | $0.00-$0.50 | 0-2% | 0-1.5% |
| Base, status quo | $600M | 30% | ~$1.50 | ~6.5% | ~4.9% |
| Bull, freight surge | $1.2B | 50% | ~$5.00 | ~21.7% | ~16.3% |
Investors must also account for Israel's 25% dividend withholding tax. A headline 20% dividend yield becomes about 15% in the account, and the source cautions that tax-credit procedures under treaties such as Korea-Israel can be complex.
Commercially, the key service is ZIM eCommerce Xpress, or ZEX, on the transpacific route. It targets high-value, time-sensitive ecommerce freight with a 12.5-day transit from Yantian, China, to Los Angeles. But 3Q25 volume was down 5% year over year, indicating even premium lanes are affected by demand slowdown. Cooperation with MSC on Asia-U.S. East Coast and Gulf lanes works as a buffer through slot swaps and cost efficiency.
5. Valuation and scenarios
The source says ZIM often trades below 3.0x forward EV/EBITDA under the conflict scenario, and when war-premium earnings spike, P/E can fall to 2-4x. This is because the market prices in the possibility of future earnings collapse.
| FY2025 guidance | Original | Updated Nov 2025 | Implication |
|---|---|---|---|
| Adjusted EBITDA | $1.8B-$2.2B | $2.0B-$2.2B | Management lifted the low end of 4Q profit expectations |
| Adjusted EBIT | $550M-$950M | $700M-$900M | Evidence of operating efficiency and cost control |
Long-war bull case
- The Red Sea route remains closed through 2026 and global demand stabilizes.
- ZIM generates more than USD 2 billion of EBITDA in 2026.
- High dividends continue and the market treats higher freight as the new normal, allowing rerating.
- The source target range is USD 25-30 per share.
Sudden-peace bear case
- Gaza/Lebanon ceasefire talks reopen the Red Sea route in 2Q26.
- Spot freight collapses toward USD 1,000 per TEU.
- Lease liabilities pressure revenue, cash burn begins, and dividends are cut.
- The source target price is below USD 10 per share.
Interpretation: For aggressive traders, ZIM is a long-volatility position based on the war premium lasting longer than consensus expects. For conservative dividend investors, the volatility, withholding tax, and capital-loss risk from a sudden peace event make avoidance more appropriate. Weekly SCFI data and Middle East geopolitical headlines are the key monitoring items.
Sources
- Original Naver Blog post: https://m.blog.naver.com/PostView.naver?blogId=star_of_self&logNo=224167465876
- Reference 1: The Red Sea Shipping Crisis (2024-2025)
- Reference 2: ZIM imposes New War Risk Premium Charge for Israel calls
- Reference 3: Red Sea Return: What It Means for 2026 Container Shipping Contract Rates
- Reference 4: Carriers abandon February General Rate Increase
- Reference 5: Drewry World Container Index - 29 Jan
- Reference 6: 2026 Ocean Outlook - Xeneta
- Reference 7: Shipping operators stocks tumble amid Gaza ceasefire talks
- Reference 8: ZIM customer advisory: war risk premium charge
- Reference 9: ZIM customer advisory regarding the war situation in Israel
- Reference 10: ZIM Updates on Withholding Tax Procedures on December 2025 Cash Dividend
- Reference 11: Red Sea Crisis Update: Route Alternatives & Cost Impacts on Global Shipping