DEEP RESEARCH · TANKER MARKET
Tanker Market Deep Dive: Structural Differences Between TNK and STNG
A comparison of how geopolitical logistics shifts, the shadow fleet, and refinery dislocation affect crude and product tankers.
0. Bottom line first
I see the core of the 2026 tanker market not as simple oil demand, but as route inefficiency and ton-mile growth. TNK is the debt-free crude-tanker defensive option, while STNG offers product-tanker and shareholder-return leverage.
Ton-mile growth
Russian sanctions, Red Sea diversions, and refinery relocation are breaking former optimized routes.
Net-cash defense
The source states that TNK had no debt and $775 million of cash at the end of 3Q 2025.
Product-tanker leverage
STNG maximizes refinery-dislocation upside through a 93-vessel, all-Eco fleet and aggressive buybacks.
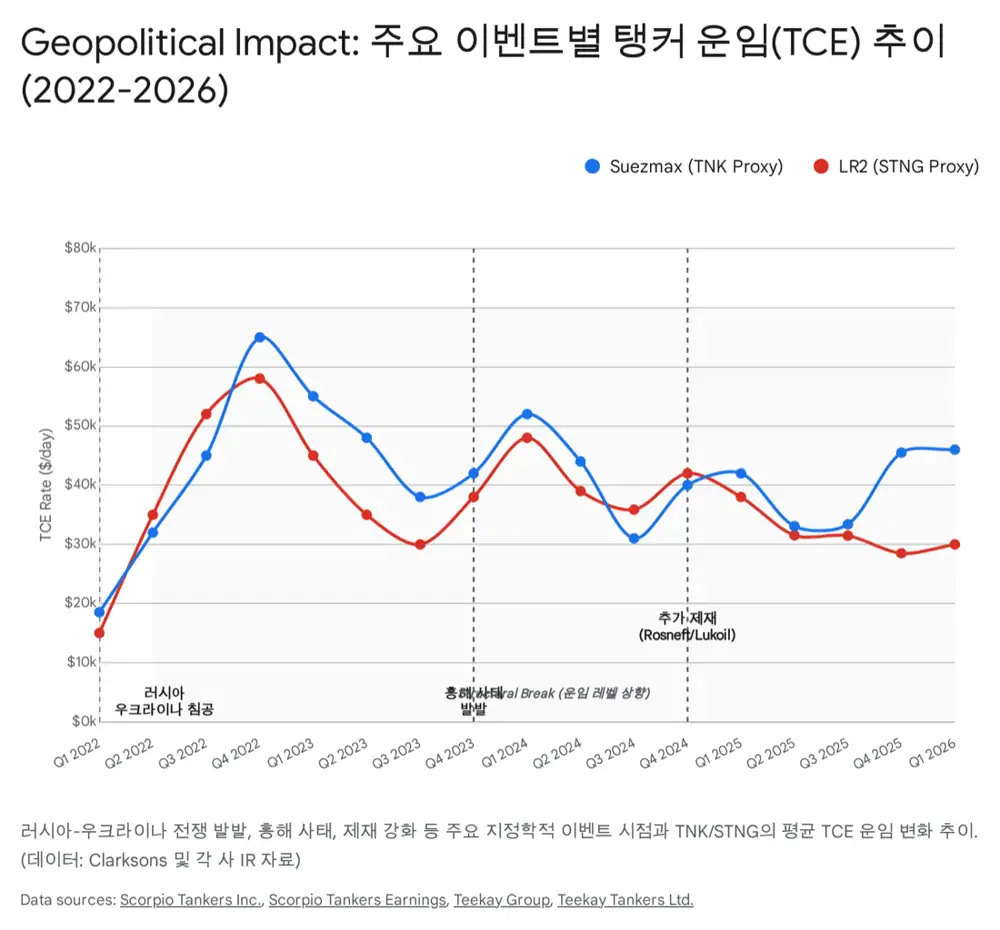
1. Macro: fragmented supply chains create rates
Official fact: The source analyzes TNK and STNG against a January 2026 backdrop in which Suezmax rates exceeded $120,000 per day and LR2 rates exceeded $100,000 per day. It also cites January 23, 2026 levels of $120,000 for Suezmax, $100,000 for LR2, and $90,000 for Aframax.
- Shadow fleet: TNK management is cited as saying about 20% of the global mid-sized tanker fleet, or 344 ships, is more than 20 years old, with many used to bypass sanctions.
- Russian sanctions: sanctions on Rosneft and Lukoil affect companies representing about 50% of Russian crude exports, pushing Indian and Chinese refiners toward alternatives.
- Red Sea disruption: Cape of Good Hope diversion instead of Suez raises Asia-Europe sailing distance by more than about 40%, absorbing vessel supply.
Interpretation: Whether the rate spike is temporary or structurally higher depends on whether the shadow fleet can return to compliant markets and how long Red Sea and sanctions-related inefficiencies persist.
2. Teekay Tankers: a defensive crude-shipping option
TNK is focused on crude shipping, especially Suezmax and Aframax vessels. The source emphasizes their flexibility in ports and Atlantic Basin routes where VLCCs are less suitable.
| Item | Source TNK point |
|---|---|
| Supply environment | Mid-sized tanker orderbook is about 16% of the fleet, a historical low, while average vessel age is at the highest level since the 1990s |
| Balance sheet | No debt and $775 million in cash at the end of 3Q 2025 |
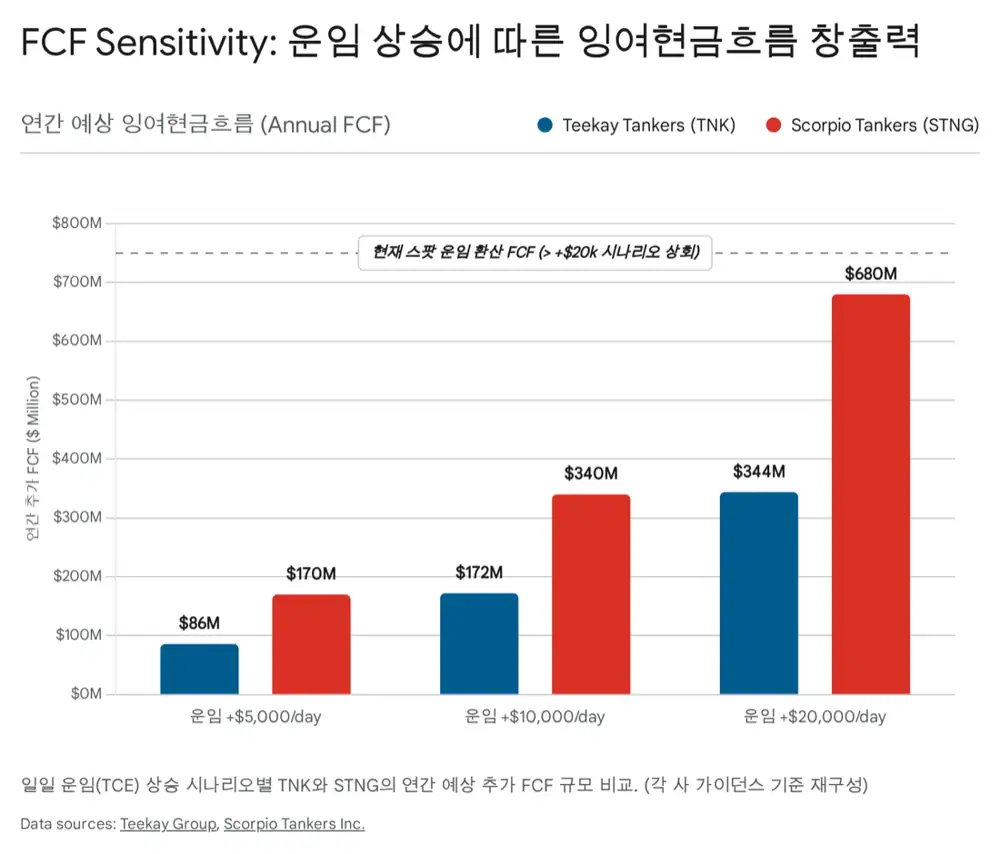
| Rate sensitivity | Each $5,000/day rate increase adds about $1.66 of annual FCF per share |
| Asset rotation | Sold four older Suezmaxes and one LR2 for $158.5 million |
| Reinvestment | Bought one modern 2017-built Suezmax and a 50% interest in a VLCC joint venture |
| Dividend | Fixed quarterly dividend of $0.25 |
Interpretation: TNK prioritizes fleet renewal and cash over aggressive capital return. That can look conservative in an upcycle, but in a cyclical industry it preserves survival and asset-purchase optionality in downturns.
3. Scorpio Tankers: product-tanker growth leverage
STNG’s investment theme is refinery dislocation. From 2020 to 2026, closures of older refineries in the West and new capacity in the Middle East, China, and India force refined products to move over longer distances.
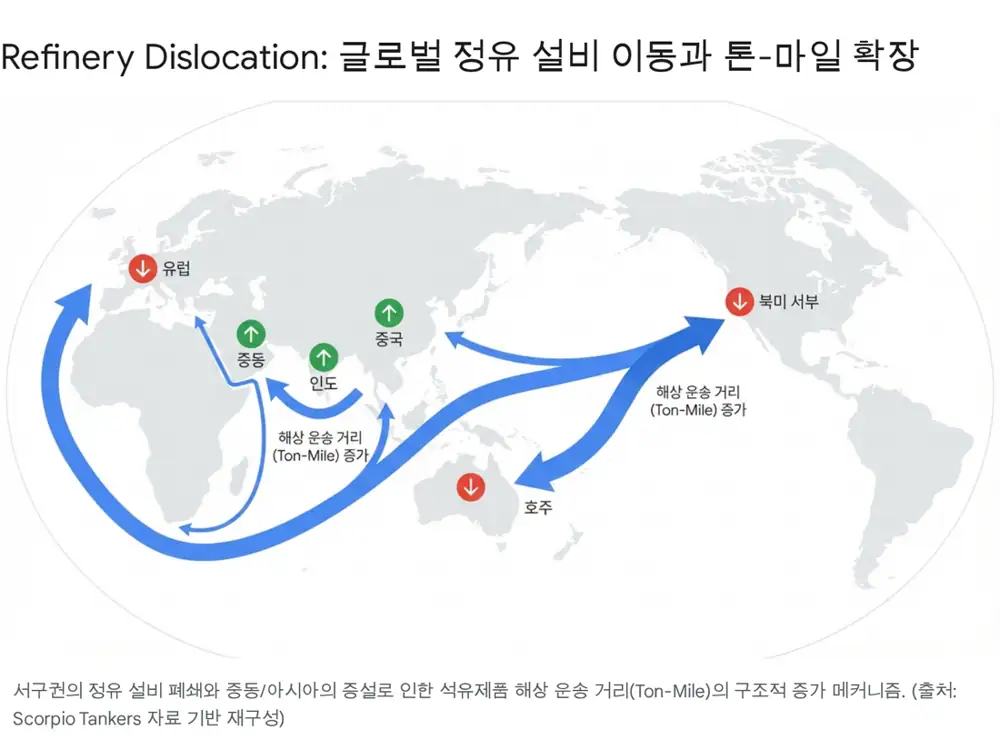
- European diesel: importing from the Middle East or India instead of local refining can increase travel distance by 2-3x.
- Australia: the source says dependence on imported finished products from Asia is approaching 100% after refinery closures.
- U.S. PADD 5: West Coast refinery closures could potentially more than double imports from Asia.
| Item | Source STNG point |
|---|---|
| Fleet | 93 vessels, all Eco, with average age of 9.8 years |
| Operating leverage | Each $10,000/day rate increase can generate about $340 million of additional annual cash flow |
| Buybacks | $826 million repurchased from January 2023 to September 2025 |
| Dividends | $202 million paid over the same period; quarterly dividend raised 5% to $0.42 |
| Debt | Early repayment of $154.6 million in October 2025, addressing 2026-2027 maturities |
| BEP | Breakeven of about $11,000/day |
Interpretation: STNG is the cleaner exposure to refined-product ton-mile growth. Its young Eco fleet and buybacks can compound per-share value quickly in strong rates, but the same leverage can work in reverse if product-tanker rates fall.
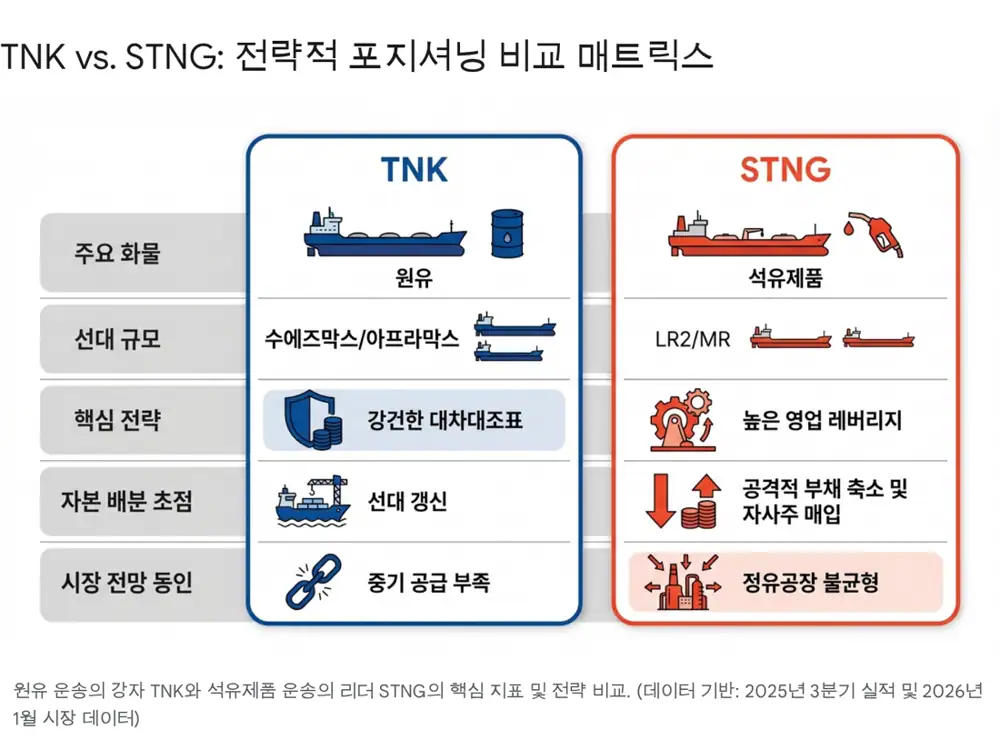
4. TNK vs. STNG: two different investor profiles
| Item | Teekay Tankers | Scorpio Tankers | Note |
|---|---|---|---|
| Main vessels | Crude: Suezmax, Aframax | Products: LR2, MR | TNK is crude-focused; STNG is product-focused |
| Fleet size | Undisclosed, with sales/purchases in progress | 93 vessels, 100% Eco | STNG leads in scale and modernization |
| Average age | Undisclosed, global average 13.2 years | 9.8 years | STNG fleet is younger |
| Cash | $775 million | - | TNK’s cash position is central |
| Net debt | Net cash, debt-free | $383 million pro forma | TNK offers stability; STNG offers leverage |
| BEP | About $11,300/day | About $11,000/day | Both are low versus current rates |
| Capital allocation | Fleet renewal and fixed dividend | Buybacks and dividend growth | STNG is more aggressive on returns |
| 3Q 2025 adjusted net income | $53.3 million | $72.7 million | STNG had the larger profit base |
5. Conclusion: separate crude stability from product growth
The source frames TNK’s net-cash safety margin as better suited to conservative investors, while STNG’s refinery-dislocation exposure and buyback/dividend mix are better suited to more aggressive investors. LR2 rates above $100,000 amplify STNG’s leverage, but if recession or crude-demand concerns dominate, TNK’s debt-free balance sheet can be more comfortable.
Interpretation: I see the two companies less as substitutes and more as different roles within tanker exposure. TNK is downside defense and NAV; STNG is product-tanker upside and shareholder return.