DEEP RESEARCH · Samsung C&T (028260)
Samsung C&T — Portfolio Transformation and the Re-rating Inflection
Construction (P5 returns) · Trading (solar organizer) · Bio (Plant 5) · Shareholder return (new 2026 policy) — four axes audited
0. Bottom line first
Samsung C&T is evolving from a "managed holding company" into a high-margin portfolio organizer. 9M-2025 consolidated revenue KRW 10.15 trn (-1.5%), operating profit KRW 994 bn (+35.1%), OPM 9.8% (+2.7pp). Bio carries 72.6% of group OP, lifting earnings quality. Pyeongtaek P5 groundbreaking in December gives construction a clear 2026 rebound. Treasury-stock cancellation completes by 2026 and a new shareholder-return policy is due in early 2026 — triggers to compress the 60%+ NAV discount. The margin of safety is substantial.
1. Beyond the conglomerate dilemma
Samsung C&T is effectively the Samsung Group's holding company and a conglomerate spanning construction, trading, fashion, leisure, and bio. Past valuation relied on a simple SOTP of core operations + equity holdings. Recent strategic moves accelerate the shift from "managed holding company" to "high-margin portfolio organizer."
2. Q3-2025 financial review
2.1 Consolidated headline — bio drives earnings-quality lift
Official fact: Q3-2025 consolidated preliminary revenue KRW 10.15 trn, operating profit KRW 994 bn. YoY revenue -1.5%, operating profit +35.1%. OPM 9.8% (vs 7.1%, +2.7pp).
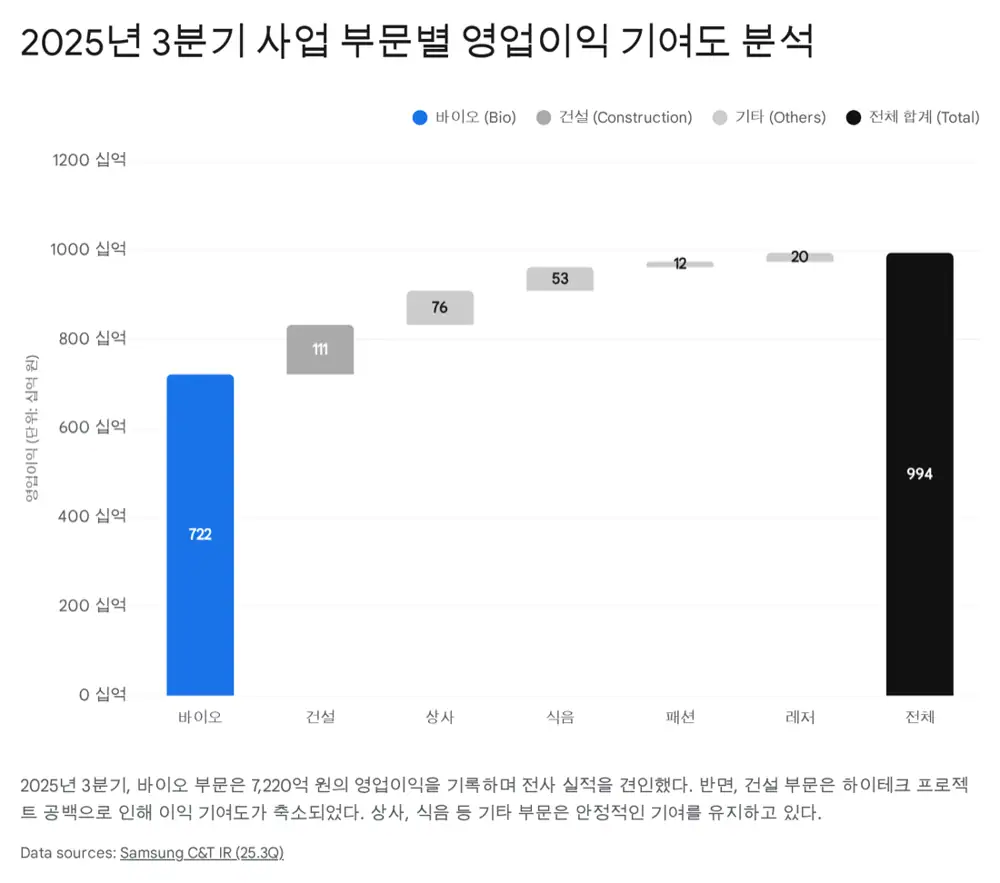
2.2 Segment breakdown (Q3-2025)
| Segment | Revenue (KRW bn) | OP (KRW bn) | YoY OP change | Key drivers |
|---|---|---|---|---|
| Construction | 3,090 | 111 | ▼ 125 | P3 completion + P4/P5 timing gap |
| Trading | 3,885 | 76 | ▲ 5 | Commodity volume + solar-development earnings |
| Fashion | 445 | 12 | ▼ 9 | Seasonal lull + soft consumer demand |
| Leisure | 205 | 20 | ▼ 9 | Weather-driven park traffic decline |
| F&B | 866 | 53 | ▲ 6 | Welstory winning external accounts |
| Bio | 1,660 | 722 | ▲ 390 | Plant 4 utilization + milestone payments |
Interpretation: Bio carries ~72.6% of Q3 OP. Construction is the laggard (OP -53%) — P3 completed, P4/P5 not yet at full pace. Cumulative orders KRW 12.21 trn + rising overseas share lay the foundation for recovery. Trading shifts from pure trading margins toward project-development gains — cumulative US solar divestment gains $29.8 mn.
3. Construction — HiTech returns + next-gen energy
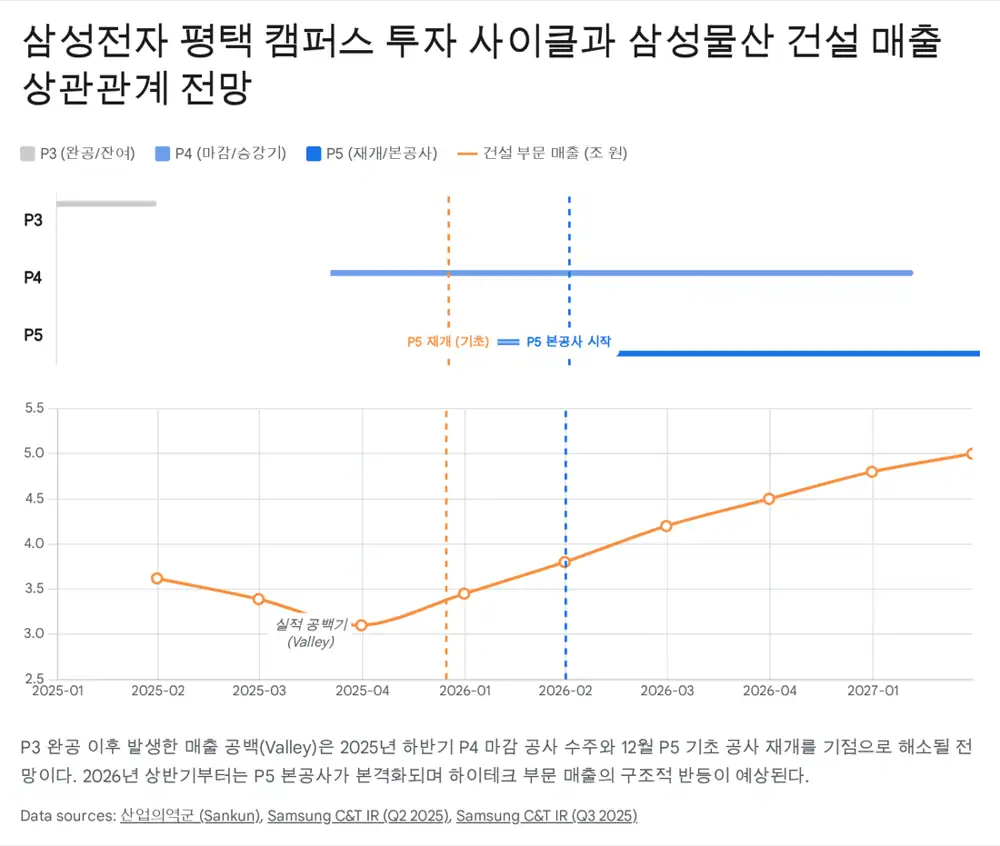
3.1 P5 restart = 2026 rebound
Official fact: Samsung Electronics resumes Pyeongtaek Plant 5 (P5) investment. PC excavation and foundation work begin mid-December 2025; full-scale work to ramp April 2026. Already booked ~KRW 2.2 trn for P4 finishing (Ph4) in Q3-2025.
P5 targets finishing by 2027 and operation by 2H-2028 → 3-4 years of stable revenue base.
3.2 Energy solutions — SMR + renewables
- SMR: Stake / partnership with NuScale Power (US) → MOU with Synthos Green Energy (Poland) → participated in Romania SMR FEED. Validated 'modularized steel-plate concrete construction' — proves EPC capability. Material order and revenue contribution expected from 2026.
- Global renewables: KRW 1 trn of Australian renewables/HVDC orders in 2025 alone. Qatar solar plant order worth KRW 1.5 trn.
4. Trading — differentiated "organizer" model
4.1 Three-way comparison
| Item | Samsung C&T | POSCO International | LX International |
|---|---|---|---|
| Core strategy | Project Organizer (development) | Value-Chain Integrator (vertical) | Asset Operator |
| Key assets | Solar pipeline, SMR rights | LNG fields / terminals / power | Coal & nickel mines, Pantos |
| Revenue model | Project development & sale (capital gains), fees | Resource production / sales + power operations | Resource extraction + logistics freight |
| Risk | Low capital tie-up; deal-completion volatility | Heavy CAPEX, oil-price sensitive | Commodity + shipping volatility |
| Recent moves | Expanded US solar divestment gains | Post POSCO Energy merger LNG chain | Indonesian nickel mine acquisition |
4.2 Solar — a recurring profit model
- 9M-2025 cumulative solar divestment gains $29.8 mn (~KRW 40 bn), with more closings expected in Q4.
- Pipeline 21.9 GW (more than double 2021). Now established as a recurring profit model rather than one-off gains.
4.3 2026 commodities backdrop
- Oil: Goldman / JPM see 2026 Brent ~$60/bbl — a trading-margin headwind, but limited risk for Samsung C&T given low direct resource ownership.
- Copper: AI datacenter + power-grid demand supports $10,000–11,000/t. Steel demand recovery limited by Chinese supply + trade barriers. Battery recycling and copper trading offset volatility.
5. Bio — the heart of group earnings
- Q3-2025 OPM 40%+ — breaks the manufacturing ceiling.
- Plant 5 (180 kL) on stream takes total capacity to 784 kL, cementing #1 CDMO position.
- In 2026, Plant 5 utilization ramp + ADC-dedicated facility → revenue/profit step-up and earnings-quality uplift.
6. Governance & valuation — the key to closing the discount
6.1 NAV discount and the SK Inc. comparison
Samsung C&T's market cap is well below its listed-affiliate stakes (Samsung Electronics, Samsung Biologics, Samsung Life). NAV discount is over 60%. SK Inc.'s discount reflects SK On losses + reshuffle-risk premium. Samsung C&T's discount stems from conservative capital allocation + governance (inheritance-tax) uncertainty, despite a strong balance sheet.
6.2 The 2026 shareholder-return policy
The current 3-year policy (2023-2025) returns 60-70% of affiliate dividend income and cancels all treasury stock (13.2% common, 9.8% preferred). Cancellations are proceeding on plan, with completion targeted by 2026. The new policy (2026-2028), due early 2026, is expected to include:
- Higher payout: with fewer shares outstanding post-cancellation, DPS rises structurally. The market expects fixing the upper end of the payout range or adding a minimum DPS floor.
- Alignment with Korea's "Value-Up" program: explicit ROE targets and possibly special dividends from non-core asset sales.
- Equity-value reset: full treasury cancellation lifts per-share NAV directly — 2026 could be the start of the re-rating.

7. 2026 outlook & conclusion
7.1 Consensus
- Revenue: KRW 42.8 trn – 44.3 trn (YoY ~+7%).
- Operating profit: KRW 3.6 trn – 3.7 trn (YoY ~+13%).
- Drivers: full Plant 5 contribution; construction recognition of P5 / large overseas projects; consumer rebound aided by rate cuts.
7.2 Conclusion — the re-rating conditions are in place
2025 proved earnings stability: bio offset construction softness. 2026 should bring across-the-board turnaround + an upgraded shareholder-return policy → a real re-rating. Low PBR and a deep NAV discount paradoxically provide a meaningful margin of safety.
Key takeaways
- HiTech returns: P5 groundbreaking late-2025 → 2026 construction profit rebound.
- Bio engine accelerates: Plant 5 (Apr 2025) + ADC market entry.
- Organizer evolution: Trading goes asset-light + solar / battery recycling traction.
- Shareholder-return optionality: New 2026 policy + full treasury cancellation.
Sources
- Original post (Naver Blog): https://m.blog.naver.com/PostView.naver?blogId=star_of_self&logNo=224115943955
- Samsung C&T (미래에셋): https://securities.miraeasset.com/bbs/download/2139472.pdf?attachmentId=2139472
- 2Q25 Conference call: https://www.samsungcnt.com/file/down.do?id=e0d4283b-6a45-4b68-8e78-7ce4c50edddb
- Samsung C&T 3Q 2025 Earnings Release: https://www.samsungcnt.com/file/down.do?id=1b614425-4ed1-47fe-a2f7-2a77114b0ac5
- 3Q25 Conference call: https://www.samsungcnt.com/file/down.do?id=4cae2a92-b363-4b1a-8428-00dee74af8ec
- 삼성전자 평택 P5 공사 재개 (산군): https://www.sankun.com/blog/detail/1306_%EC%82%BC%EC%84%B1%EC%A0%84%EC%9E%90_%ED%8F%89%ED%83%9D_P5_%EA%B3%B5%EC%82%AC_%EC%9E%AC%EA%B0%9C_%EC%86%8C%EC%8B%9D__%EC%8B%9C%EA%B3%B5%EC%82%AC__%ED%98%84%EC%9E%A5%EC%A0%95%EB%B3%B4__%EC%B0%A9%EA%B3%B5%ED%98%84%ED%99%A9_%EC%95%8C%EC%95%84%EB%B3%B4%EA%B8%B0
- 삼성물산 SMR 강판 공장 모듈화 (조선비즈): https://biz.chosun.com/real_estate/real_estate_general/2025/05/28/EECK6LTVP5EIRPRHDMP2ZLPBHE/
- 유사사업 기업 비교 분석 (Drive): https://drive.google.com/open?id=1JIYtKqjZiBCFjqQqoJcPAeZ5ch6pwhWwBNs2OPTavZ0
- Oil Price Forecasts 2025/2026 (JP Morgan): https://www.jpmorgan.com/insights/global-research/commodities/oil-price-forecast
- Goldman: gold $4,900 by Dec 2026, oil decline, copper favored (Investing.com): https://www.investing.com/news/commodities-news/goldman-sees-gold-at-4900-by-december2026-projects-oil-price-decline-copper-remains-favored-industrial-metal-4415903
- Commodity Markets Outlook (World Bank): https://blogs.worldbank.org/en/developmenttalk/the-commodity-markets-outlook-in-eight-charts2
- Copper prices forecast 2026 (Goldman Sachs): https://www.goldmansachs.com/insights/articles/copper-prices-forecast-to-decline-from-record-highs-in-2026
- 2026 철강세미나 — 글로벌 철강 수요 완만 개선 (철강금속신문): http://www.snmnews.com/news/articleView.html?idxno=562062
- 'AI 관련산업 맑음, 석유화학·철강은?' 2026 산업기상도 (한경): https://magazine.hankyung.com/business/article/202512153693b
- Samsung Biologics 2Q25 results: https://samsungbiologics.com/media/company-news/samsung-biologics-reports-second-quarter-2025-financial-results
- 제2 바이오캠퍼스 (Samsung Biologics): https://samsungbiologics.com/kr/about/bio-campus2
- CDMO Samsung expands with sixth plant (BioProcess Intl): https://www.bioprocessintl.com/facilities-capacity/cdmo-samsung-expands-with-sixth-plant-amid-25-q1-revenue-growth
- Samsung Biologics 1Q25 results: https://samsungbiologics.com/media/company-news/samsung-biologics-reports-first-quarter-2025-financial-results
- SK 지주사 분석 프롬프트 (Drive): https://drive.google.com/open?id=1hJxgtEhimGVJxQK0qmMJNGO8zIULckDjdhLiyBcJecE
- 삼성물산 (흥국증권): https://www.heungkuksec.co.kr/download.do?type=Board&key=28148
- 삼성물산, 1조 규모 자사주 소각 결정 (한국경제): https://www.hankyung.com/article/2024020160886
- 삼성물산 자회사 가치 + 주주환원 기대 (아시아경제): https://core.asiae.co.kr/article/2025120816154741157
- 삼성물산 주주환원정책 추가시 금상첨화 — 흥국 (Market In): https://marketin.edaily.co.kr/News/ReadE?newsId=02522326642395568
- KB증권: 삼성물산, 2026까지 자사주 전량 소각·배당성향 상승 기대 (조선비즈): https://biz.chosun.com/stock/stock_general/2024/09/03/DVEXSVA2QNCV7E2Z3OSKHZ6YCI/
- 삼성물산 (BondWeb): https://www.bondweb.co.kr/_research/downloadPage.asp?number=878692&gn=1
- Samsung C&T Preferred (02826K) Analysis — Twelve Data: https://twelvedata.com/markets/101684/stock/krx/02826k/analysis
- 실적·주주환원 다 잡는 삼성물산…성장 가치주로 변신 (토스증권/뉴스핌): https://www.tossinvest.com/?contentType=news&contentParams=%7B%22id%22%3A%22newspim_20251205000164%22%7D