DEEP RESEARCH · DOLLAR LIQUIDITY
Reading Dollar Liquidity Through SOFR, Reserves, and RRP
A plumbing-level view of how money-market stress can migrate into market liquidity.
0. Bottom line first
My core view is simple: during QT, the RRP buffer drains first, bank reserves then come under pressure, and finally the SOFR-IORB spread jumps as markets start saying that cash has become expensive.
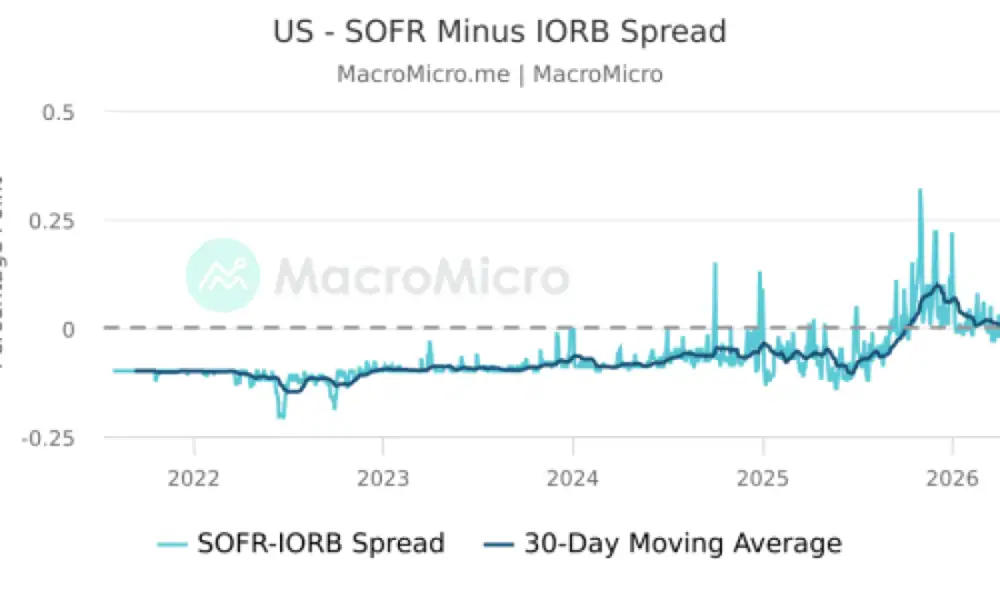
Official fact: The source post used the reference video https://youtu.be/nkG_WIPTvqA?si=ru_zEpW3UgvVwL5V, the SOFR-IORB spread chart https://en.macromicro.me/charts/141325/us-sofriorb-spread, and the FRED graph of RRP and reserves https://fred.stlouisfed.org/graph/?g=1NVpJ as the key materials.
Interpretation: The two charts separate symptom from cause. A SOFR spike is the symptom; RRP depletion and falling reserves are the structural background that can create it.
1. Terms first
| Term | Meaning | Market role |
|---|---|---|
| Dollar liquidity | Dollar cash immediately usable for settlement and trading | Raw material for credit and market making |
| Market liquidity | Ability to trade assets without large price impact | Determines order-book depth and volatility |
| SOFR | Actual overnight repo rate secured by U.S. Treasuries | Money-market stress indicator |
| RRP | Fed reverse repo facility absorbing cash from MMFs and dealers | Excess-liquidity buffer and rate floor |
| Reserves | Commercial-bank balances at the Fed | Core operating cash of the banking system |
| TGA | U.S. Treasury cash account at the Fed | Absorbs liquidity through issuance and releases it through spending |
| QT | Fed balance-sheet runoff | Tightens the dollar-liquidity faucet |
| IORB | Interest paid on reserve balances | Reference return for banks holding cash |
2. Ample reserves and QT
The Fed operates an ample-reserves framework, using administered rates such as IORB and the RRP rate rather than forcing reserves into extreme scarcity. The risk is that continued QT can turn “ample” into scarce.
Interpretation: Early in QT, RRP absorbs the impact. Once RRP moves toward zero, the next drain is bank reserves. Banks then value cash more highly and demand higher rates to lend it into repo markets.
3. Chart 2: the structural cause
The post treats RRP convergence toward zero and declining reserves as evidence of structural liquidity scarcity. RRP is the parking lot for excess liquidity; reserves are banks operating cash. Once the parking lot is empty, the system starts drawing directly on bank cash.
The message of Chart 2 is that the buffer inside the plumbing can already be disappearing before asset prices look disorderly.
4. Chart 1: the SOFR symptom
When SOFR rises materially above IORB, banks are requiring more compensation to lend cash than they can earn by leaving reserves at the Fed. The source compares this mechanism with the September 2019 repo-market episode.
5. Transmission to asset markets
- Step 1: QT and Treasury issuance shift liquidity among RRP, reserves, and TGA.
- Step 2: Once the RRP buffer drains, reserves fall and banks prefer holding cash.
- Step 3: Repo funding costs rise and the SOFR-IORB spread widens.
- Step 4: Market makers and leveraged investors face higher funding costs, thinning asset-market order books.
- Step 5: The result can be weaker market liquidity, higher volatility, and potential credit stress.
6. Monitoring dashboard
SOFR - IORB
Checks whether funding stress is escaping the policy-rate corridor.
RRP balance
Shows how much excess-liquidity buffer remains.
Bank reserves
Measures the banking systems actual operating cash.
TGA
Tracks how issuance and spending absorb or release liquidity.
The practical conclusion I want to keep is that dollar-liquidity work starts with the plumbing before it reaches price charts. RRP, reserves, and SOFR-IORB together can provide an early warning before money-market stress reaches asset markets.
Sources
- Original Naver post
- https://youtu.be/nkG_WIPTvqA?si=ru_zEpW3UgvVwL5V
- https://en.macromicro.me/charts/141325/us-sofriorb-spread
- https://fred.stlouisfed.org/graph/?g=1NVpJ
- https://www.kiep.go.kr/galleryDownload.es?bid=0002&list_no=2562&seq=1
- https://eiec.kdi.re.kr/policy/domesticView.do?ac=0000173256&issus=&pp=20&datecount=&pg=
- https://www.bok.or.kr/portal/bbs/B0000217/view.do?nttId=10071432&oldMenuNo=201151&menuNo=200144&programType=multiCont&depth=200144&relate=Y
- http://www.economy21.co.kr/news/articleView.html?idxno=1013336&replyAll=&reply_sc_order_by=C
- https://contents.premium.naver.com/wonseconomy/wonsglobaleconomy/contents/231127132631452pm
- https://ko.wikipedia.org/wiki/%EC%9C%A0%EB%8F%99%EC%84%B1#:~:text=%EC%9C%A0%EB%8F%99%EC%84%B1(market%20liquidity)%EB%8A%94%20%EA%B2%BD%EC%A0%9C%ED%95%99,%EC%97%90%EC%84%9C%EB%8F%84%20%EC%82%AC%EC%9A%A9%EB%90%98%EB%8A%94%20%EA%B0%9C%EB%85%90%EC%9D%B4%EB%8B%A4.
- https://www.emagia.com/ko/blog/secured-overnight-financing-rate-sofr-interest-rate/#:~:text=%EC%9D%98%20SOFR%20%EC%86%94%EB%A3%A8%EC%85%98-,SOFR%EC%9D%B4%EB%9E%80%3F,%EC%88%98%20%EC%9E%88%EA%B3%A0%20%ED%88%AC%EB%AA%85%ED%95%9C%20%EA%B8%88%EB%A6%AC%EC%9E%85%EB%8B%88%EB%8B%A4.
- https://www.newyorkfed.org/markets/reference-rates/sofr
- https://ko.tradingeconomics.com/united-states/secured-overnight-financing-rate
- https://www.emagia.com/ko/blog/secured-overnight-financing-rate-sofr-interest-rate/
- https://www.plusetf.co.kr/upload/fund/J250711042%EA%B0%84%EC%9D%B4%ED%88%AC%EC%9E%90%EC%84%A4%EB%AA%85%EC%84%9C-%ED%95%9C%ED%99%94%20plus%20%EB%AF%B8%EA%B5%AD%EB%8B%AC%EB%9F%ACsofr%EA%B8%88%EB%A6%AC%EC%95%A1%ED%8B%B0%EB%B8%8C%ED%8A%B9%EB%B3%84%EC%9E%90%EC%82%B0%EC%83%81%EC%9E%A5%EC%A7%80%EC%88%98%ED%88%AC%EC%9E%90%EC%8B%A0%ED%83%81(%EA%B8%88%EB%A6%AC-%ED%8C%8C%EC%83%9D%ED%98%95)(%ED%95%A9%EC%84%B1)-006190-20250701.pdf
- https://news.einfomax.co.kr/news/articleView.html?idxno=4030978
- https://www.gfmi.com/is-the-fed-easing-or-tightening-a-closer-look-at-quantitative-tightening/
- http://www.economy21.co.kr/news/articleView.html?idxno=1013321
- https://www.newyorkfed.org/newsevents/speeches/2025/per251112
- https://www.richmondfed.org/publications/research/economic_brief/2023/eb_23-07
- http://kctuli.kctu.org/include/download.php?path=/PDS/upload/&fileNm=%EC%9D%B4%EC%8A%88%ED%8E%98%EC%9D%B4%ED%8D%BC_2022_05_%EB%AF%B8%20%EC%96%91%EC%A0%81%EA%B8%B4%EC%B6%95%EC%9D%98%20%EB%B0%B0%EA%B2%BD%EA%B3%BC%20%EC%98%81%ED%96%A5_%EC%9D%B4%ED%95%9C%EC%A7%84_%EC%99%84%EB%A3%8C.pdf&realfileNm=f8032dc71138824d71c34734bcdfe72e
- https://www.emmi-benchmarks.eu/globalassets/documents/pdf/emmec/emmec-meetings-documents/presentation-chiara-manenti-usd-money-market-rates.pdf
- https://www.home.saxo/content/articles/macro/macro-update-qt-2024-01-11-11012024
- https://www.reflexivityresearch.com/all-reports/monetary-plumbing-and-liquidity-update
- https://contents.premium.naver.com/amolanc/principle/contents/250206113327146gu
- https://www.kansascityfed.org/research/economic-bulletin/rapid-declines-in-the-feds-overnight-reverse-repurchase-on-rrp-facility-may-start-to-slow/
- https://www.occ.treas.gov/publications-and-resources/publications/semiannual-risk-perspective/files/pub-semiannual-risk-perspective-fall-2023.pdf
- https://www.youtube.com/watch?v=sJhKwhqtyFE
- https://www.sageadvisory.com/what-the-decline-in-on-rrp-means-for-markets/
- https://news.einfomax.co.kr/news/articleView.html?idxno=4374794
- https://www.newyorkfed.org/newsevents/speeches/2024/per240926
- https://www.investing.com/analysis/are-us-bank-reserves-becoming-too-scarce-200668894
- https://www.hani.co.kr/arti/economy/economy_general/1228088.html
- https://contents.premium.naver.com/wonseconomy/wonsglobaleconomy/contents/250106142857559kb
- https://marketin.edaily.co.kr/News/ReadE?newsId=03188166642034112
- https://www.montinvest.com/investor-insights/learn-about-investing/crossborder-capital-liquidity-warning
- https://www.federalreserve.gov/econres/notes/feds-notes/monitoring-reserve-scarcity-through-nonbank-cash-lenders-20250328.html
- https://www.moomoo.com/news/post/61500191/us-liquidity-crunch-persists-is-the-market-forcing-the-fed
- http://www.economy21.co.kr/news/articleView.html?idxno=1015644
- https://www.schwab.com/learn/story/whats-move-index-and-why-it-might-matter
- https://www.independentresearchforum.com/editions/224?search_cut=Reliance
- https://www.kitces.com/blog/q4-2025-top-10-charts-clearnomics-market-themes-volatility-investment-portfolio-interest-investors-client-conversations-financial/
- https://www.brookings.edu/articles/treasury-market-resilience-ever-more-important/
- https://libertystreeteconomics.newyorkfed.org/2023/12/dropping-like-a-stone-on-rrp-take-up-in-the-second-half-of-2023/
- https://www.bis.org/publ/work606.pdf
- https://securities.miraeasset.com/bbs/download/2036475.pdf?attachmentId=2036475
- https://news.einfomax.co.kr/news/articleView.html?idxno=4383627
- https://v.daum.net/v/20251114163000134