DEEP RESEARCH · SAMSUNG ELECTRONICS MEMORY CYCLE
Reading Samsung Electronics Through the Memory Super Cycle
A chart-based note comparing the 2016-2017 cycle with the possible 2025 AI inference cycle
0. Bottom line first
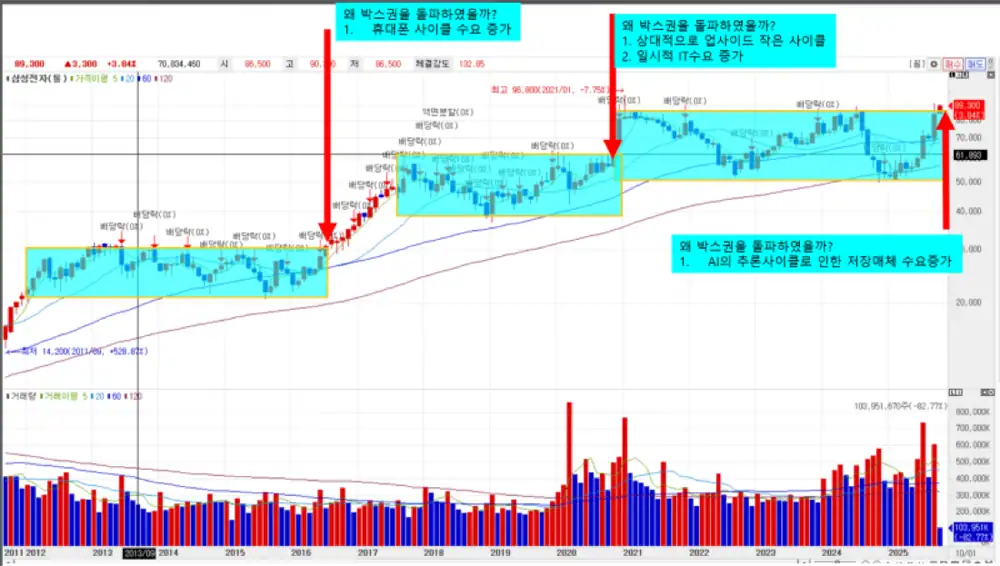
If Samsung Electronics is trying to break above a roughly four-and-a-half-year range, I do not see it as just a chart event. The demand cycle behind the breakout matters first.
Interpretation: The 2016-2017 move was tied to mobile and data-center demand, 2020 to temporary COVID-era demand, and 2025 may be tied to storage demand from the AI inference cycle. The 2025 cycle still needs time to be confirmed.
From 30,000 won range to 58,000 won
From 60,000 won range to 95,000 won
After 95,000 won: unknown
1. Three Demand Cycles Visible in the Chart
Official fact: The source notes that Samsung Electronics is attempting to break above its prior high and that the latest range appears to have lasted about four and a half years.
| Period | Demand backdrop in the source | Price area | Read |
|---|---|---|---|
| 2016-2017 | Rising phone demand, with replacement demand after the Galaxy Note 7 overheating issue | Breakout from 30,000 won range to 58,000 won | A cycle where mobile/data-center demand met supply constraints |
| 2020 | Likely temporary demand increase from COVID | Breakout from 60,000 won range to 95,000 won | Pandemic demand reflected in memory pricing and share price |
| 2025 | Potential storage demand from the AI inference cycle | After breaking 95,000 won: unknown | A period to test whether AI infrastructure lifts memory and storage demand |
2. Comparing 2016-2017 With the 2025 AI Cycle
Official fact: The source describes the current market as similar to the mid-2017 “peak supply constraint” phase. It cites that most 2025-2026 HBM capacity has already been sold and that 2026 general-purpose DRAM undersupply could be 23%, more than twice the 11% HBM shortage estimate.
Interpretation: AI data-center demand may be more structural than prior server replacement cycles, but simultaneous capex by the three major suppliers raises the risk of oversupply and price correction in 2026-2027.
Demand Shift
Demand moved from PC DRAM toward mobile and data-center NAND, and DRAM contract prices turned upward after 18 months.
HBM Bottleneck
AI accelerator demand made HBM the bottleneck, while DRAM capacity conversion toward HBM tightened legacy supply.
Expansion Risk
HBM4 competition, Samsung P4/P5 investment, and NAND storage demand may unfold together.
3. Memory Demand Map After 2026
Official fact: The source highlights NVIDIA Rubin, Rubin GPUs R100/R200, Rubin CPX, 128GB GDDR7, SOCAMM2, and high-capacity NAND as demand streams after 2026.
4. Related Reading
Related cycle note: https://blog.naver.com/star_of_self/224034851149

Sources
- Original post: https://m.blog.naver.com/PostView.naver?blogId=star_of_self&logNo=224034871195
- Related post: KOSPI200 Case Study #6 - IT, Samsung Electronics leadership cycle: https://blog.naver.com/star_of_self/224034851149