DEEP RESEARCH · SNU PRECISION/CHART PSYCHOLOGY
[SNU Precision] Chart Psychology
A short chart memo on using price action only when it is confirmed by meaningful volume
0. Bottom line first
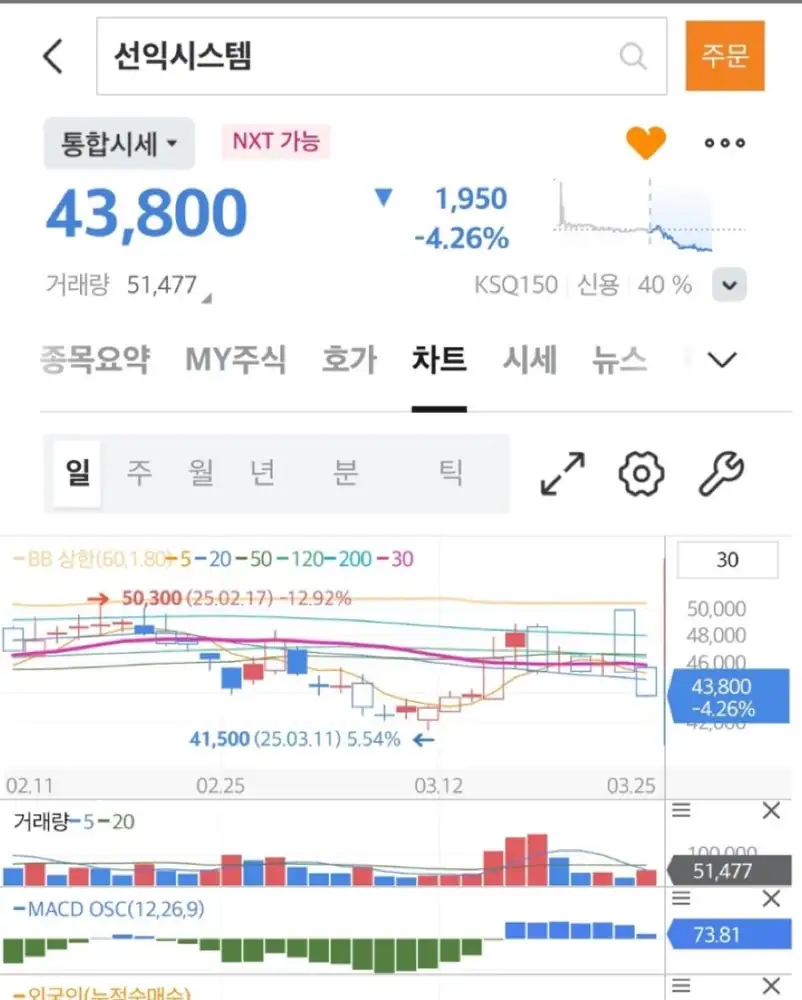
I view charts as a way to check psychology and factual context. But today’s move in SNU Precision looks like fluctuation inside a box range, and the volume does not look meaningful compared with the volume seen during the previous rise.
1. My chart filter
Interpretation: If someone knows information first, they may try to reflect it in the price. That is why I think charts can help confirm market psychology and factual relationships.
Still, the condition for confirmation is volume. I only use it in decision-making when meaningful volume accompanies a break above a key support area or a decline through it.
2. Today’s read
Official fact: The source post includes one chart image for SNU Precision.
Interpretation: I read today’s move as fluctuation within the existing box range. Since the volume does not look meaningful compared with the prior rising-volume area, I do not think today provides a meaningful confirmation signal.
Meaningful signal
A move through a key support area or a decline that comes with meaningful volume.
Weak signal
Movement inside the box range, with volume I do not see as meaningful versus the prior rise.
Sources
- Original post: Naver Blog original