DEEP RESEARCH · ASSET ALLOCATION/TECHNICAL SIGNALS
U.S. Bottom-Area Bullish Candle and Hang Seng Tech Bearish Candle: Rotation and Caution Together
What high-volume candles say about the short-term temperature gap between U.S. mega caps and Hang Seng Tech
0. Bottom line first
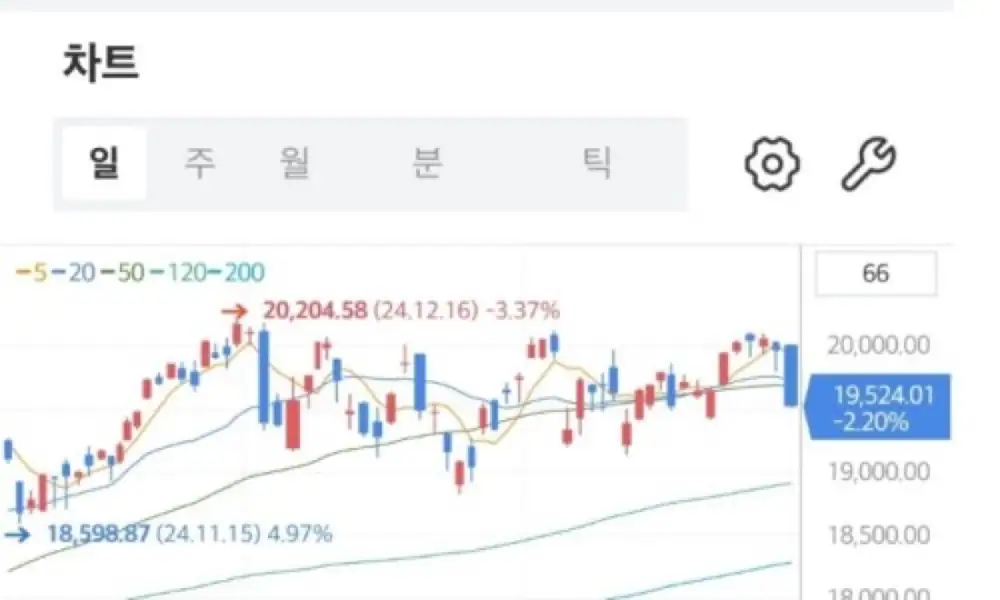
In the U.S. market, a high-volume bullish candle appeared near the bottom area. In Hang Seng Tech, a large high-volume bearish candle appeared after a recently strong run. I can read the U.S. move as rotation and buying inflow, but because resistance has not been cleared yet, I view it as an observation signal rather than confirmation.
Interpretation: A high-volume bullish candle near the bottom can be short covering. But if it were forced short covering from shorts being liquidated, I would have expected a much larger long bullish candle. This move feels closer to leading short covering or early buying inflow.
1. U.S.: high-volume bullish candle near the bottom
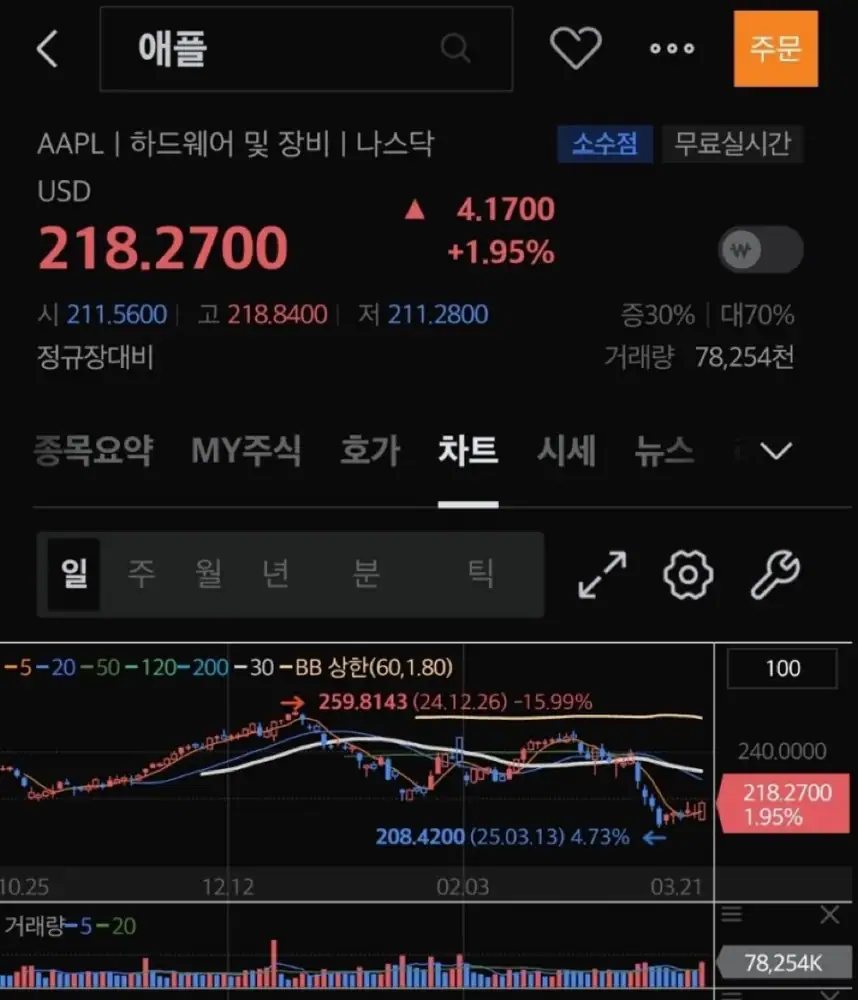
A high-volume bullish candle appeared near the bottom area. Looking at the largest market-cap names, volume seemed to concentrate more in Apple and Microsoft than in Tesla or Nvidia.
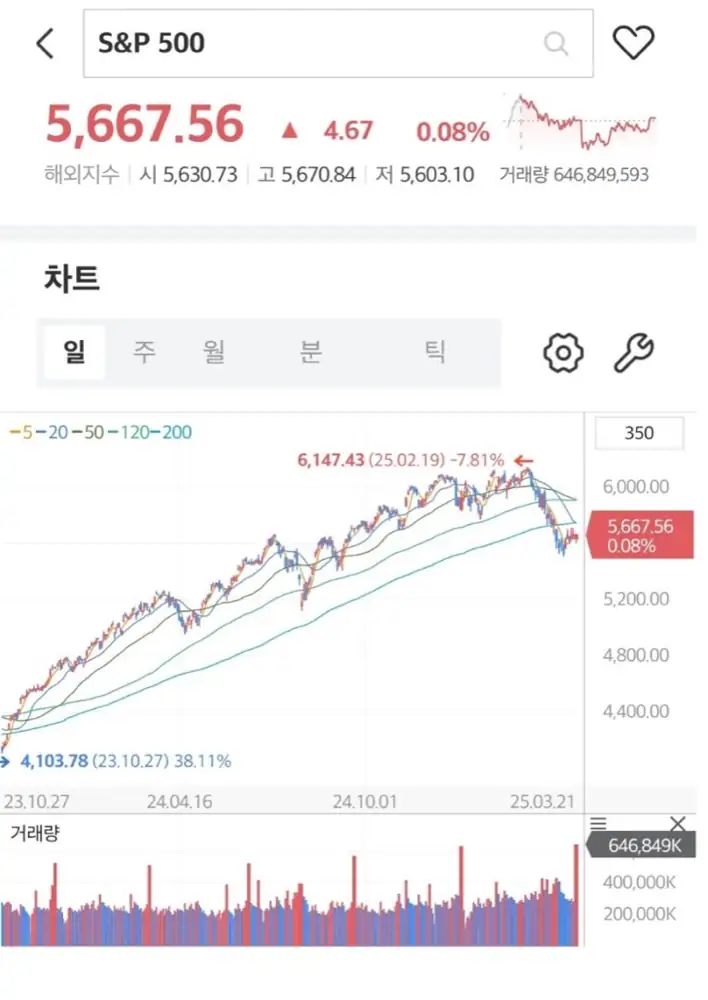
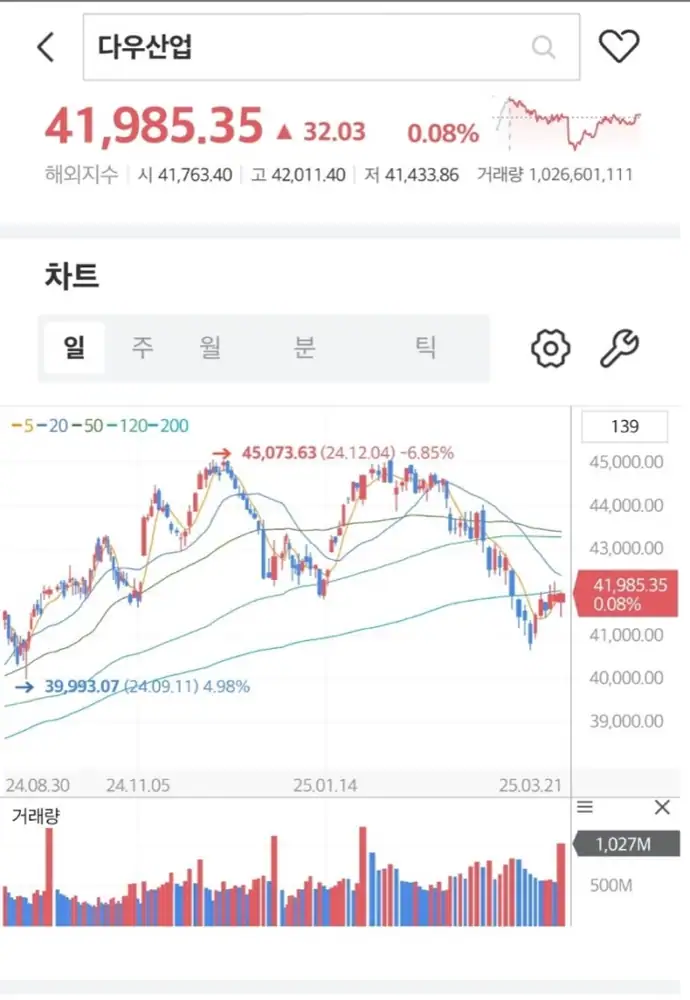
Interpretation: This can be read as rotation caused by buying inflow. However, since the market stopped at resistance without clearing the prior low area, I think the right message for now is simply to watch.
Bottom-area bullish candle
When accompanied by volume, it raises the possibility of rotation rather than a simple bounce.
Stopped at resistance
If resistance or the prior-low area is not cleared, it is hard to call it a confirmed trend reversal.
Mega-cap focus
Volume stands out more in Apple and Microsoft than in Tesla or Nvidia.
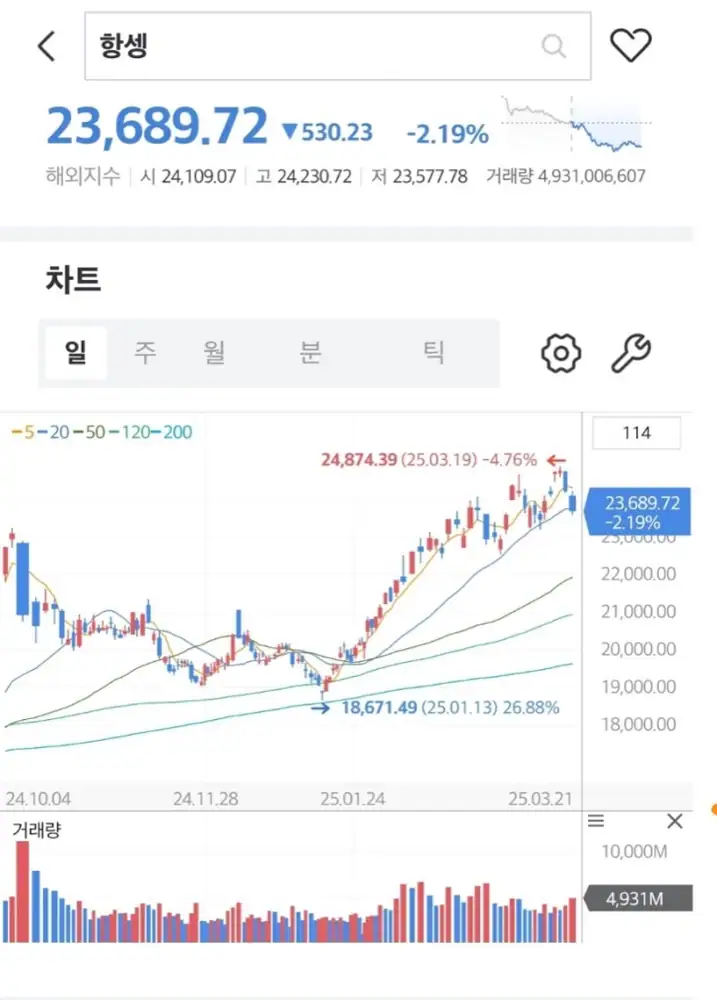
2. Hang Seng Tech: high-volume bearish candle after strength
Hang Seng Tech had been strong recently, but a large high-volume bearish candle appeared on the day. This deserves caution.
| Market | Signal of the day | My interpretation |
|---|---|---|
| U.S. mega caps | Bottom-area high-volume bullish candle | Possible rotation and early buying inflow, but resistance must be checked |
| Hang Seng Tech | Large high-volume bearish candle | Caution signal after a recently strong stretch |
3. Connecting it to the previous Nasdaq note
In the earlier Nasdaq note, I had recorded a high-volume bearish candle near the upper area. That previous record is in [Asset Allocation] Nasdaq Technical Analysis.
For context, I am only recording this after reading a few books so that I can revisit my own notes later. The above may not mean much, and it is not a buy or sell recommendation.
Sources
- Original Naver Blog post: https://m.blog.naver.com/PostView.naver?blogId=star_of_self&logNo=223805589688
- Previous Nasdaq technical analysis: https://m.blog.naver.com/star_of_self/223770478806