DEEP RESEARCH · NASDAQ TECHNICALS
Nasdaq Technical Review: Not a Chart for Heavy Allocation Yet
A short technical check focused on volume behavior and repeated failures to break new highs.
0. Bottom line first
The Nasdaq chart does not look attractive for a large allocation yet. Down candles are carrying volume, up candles are not, and the index has failed several attempts to break into new-high territory.
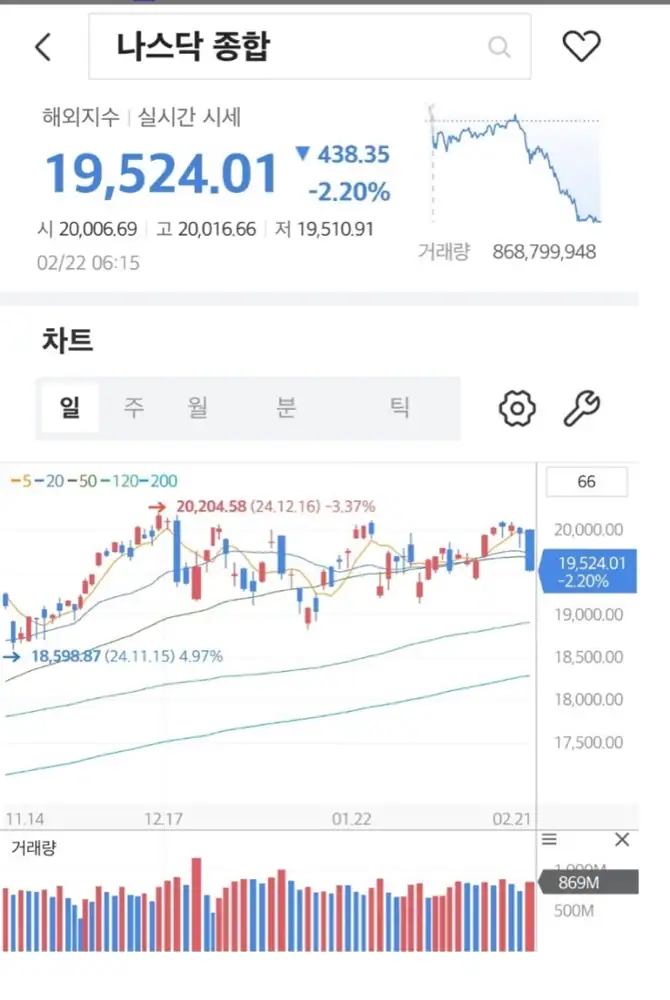
1. What volume is saying
Interpretation: Recent down candles have come with stronger volume, while up candles have lacked volume support. That suggests selling pressure is more visible than committed buying pressure.
Volume expands
Active trading on declines is a short-term supply concern.
Weak volume
A rebound without strong volume makes a breakout less convincing.
Repeated failure
Multiple failed breakouts argue for caution until the trend is reconfirmed.
2. Allocation view
I am not overly worried because the U.S. often responds with support measures when stocks fall sharply. Still, separate from that policy expectation, the chart itself is not one where I want to put on a large position.
Interpretation: Policy expectations can cushion downside, but they do not replace timing discipline. I would prefer to see a strong up candle with volume and a confirmed new-high breakout before becoming aggressive.