DEEP RESEARCH · STAR 50 INDEX
Volatility and Support in the STAR 50 Index
A personal-pension position check focused on 20-day-line support and trading-volume behavior
0. Bottom line first
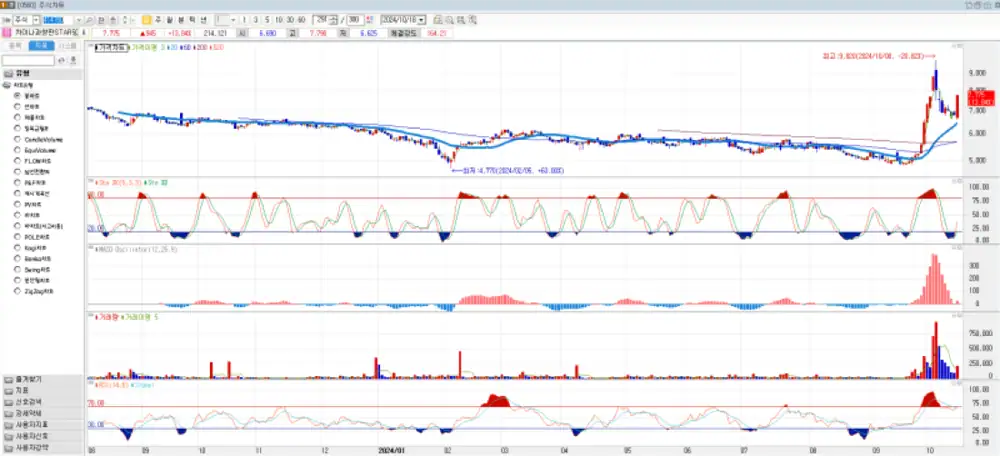
There was volatility again this week, but the index rebounded today without reaching the 20-day moving average. I am still carrying some losses, but I view the light volume during the decline and the heavier volume on the rebound positively, so I plan to keep holding for now.
1. Where the chart stands
There was some volatility this week, but the index rebounded today without moving down to the 20-day line. Let me look at the chart.
Even after today’s strong move higher, part of the position is still at a loss. Still, because it had stayed near the bottom for so long, I was not particularly worried despite the volatility.
Interpretation: In this phase, I am looking more at support and volume than at short-term profit and loss. The fact that the index did not break the 20-day line, and that volume appeared on the rebound while the decline had little volume, supports the holding view.
2. Position weight and trading activity
Position weight
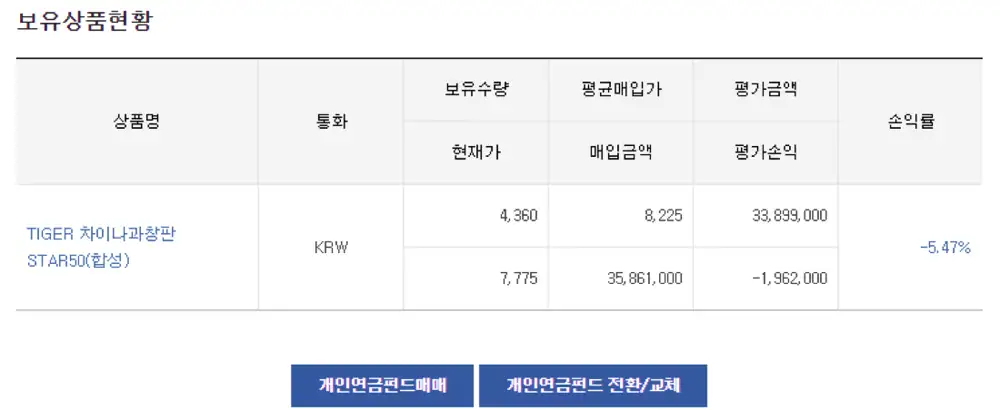
In the source post, the position weight is STAR 50 Index 100%.
This week’s trades
I did not make any trades this week.
Personal pension
The personal pension balance screen is reviewed together.
Official fact: The recorded position weight is #STAR50 Index 100%, and there were no trades this week.
3. Risk-management rule
For risk management, I am using the 20-day line as the reference. If the thick blue line on the chart breaks downward, I plan to reduce part of the position, around 50% of the exposure. If it does not recover after two days, I plan to reduce the remaining exposure as well.
4. Reference material I am watching
Please use this for work reference. I have also recently been watching a YouTube channel run by someone who previously headed Mirae Asset Global Investments’ Shanghai office: https://youtu.be/DkyjlFH_70s?si=LjEQxLySryljJWaL.
Sources
- Source post: content/네이버블로그/2024-10-18-[개인연금투자] 과창판50지수의 변동성과 지지.md
- Naver Blog: https://m.blog.naver.com/PostView.naver?blogId=star_of_self&logNo=223624404885
- Reference video: https://youtu.be/DkyjlFH_70s?si=LjEQxLySryljJWaL