DEEP RESEARCH · SHIPBUILDING MONTHLY CHARTS
Monthly Chart Analysis of the Three Major Shipbuilding Stocks
A technical read using the upper Bollinger Band (60, 1.8) on monthly charts as the key breakout and support signal
0. Bottom Line First
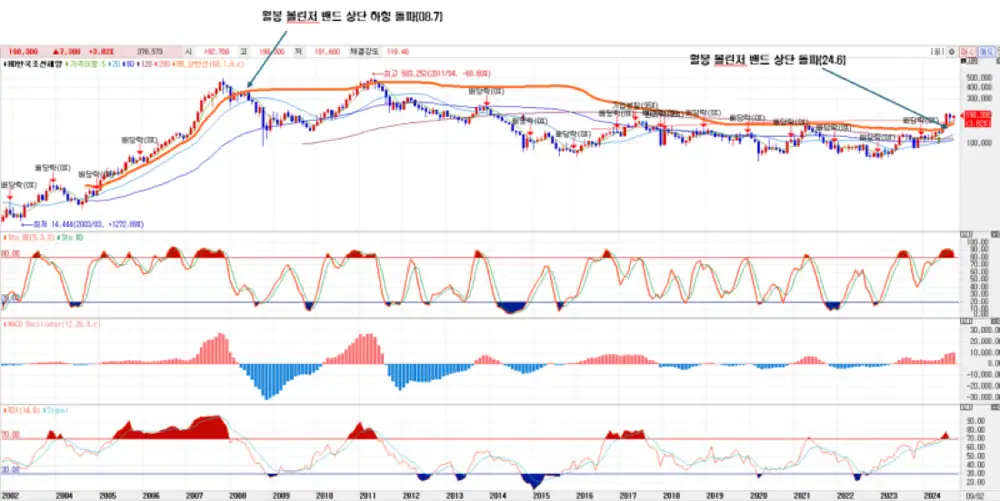
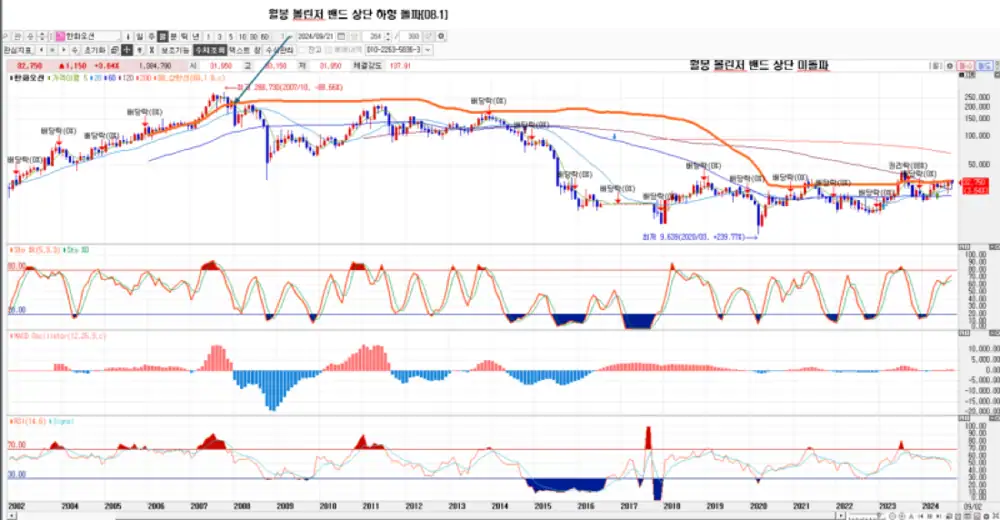
The rise in shipbuilding stocks looks fairly strong. On monthly charts, the attempt to break above the upper Bollinger Band (60, 1.8) appears to be the first such attempt since 2008, so I view this as a possible early stage of an uptrend.
- In an uptrend, I expect prices to climb while holding the upper monthly Bollinger Band as support.
- If that upper band breaks downward, I would treat it as a selling point.
- The key is not just the breakout, but whether the upper band holds afterward.
1. Monthly Chart Rule
Official fact: The original note uses the upper Bollinger Band (60, 1.8) on monthly charts as the breakout and support criterion.
Interpretation: For the three major shipbuilding stocks, this approach prioritizes monthly upper-band support as the key trend signal over short-term volatility.
2. Three Major Shipbuilding Charts
The three images below are the monthly chart-analysis images attached to the original post.

3. Overall View
Interpretation: Overall, the charts are attempting to break above the upper monthly Bollinger Band for the first time since 2008. I think it can be viewed as an early stage of an uptrend.
Rise Looks Solid
The upward move in shipbuilding stocks looks reasonably strong.
Monthly Upper Band
The key is whether the Bollinger Band (60, 1.8) upper band holds as support.
Downward Break
A break below the upper band would be treated as the selling signal.
Sources
- Original Naver Blog post: https://m.blog.naver.com/PostView.naver?blogId=star_of_self&logNo=223591269118